School Demographics
Administration
Provo City School District
- 801-374-4800
- Provo City School District Website
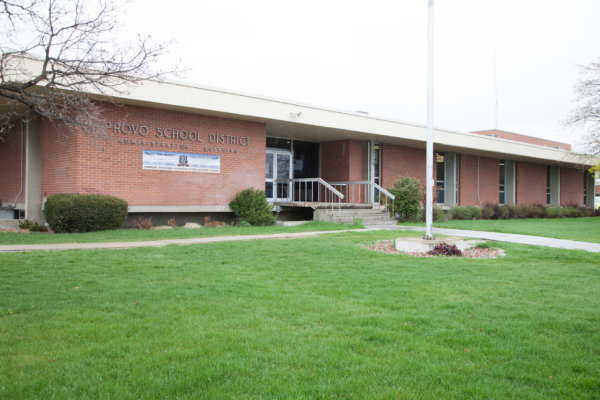
Demographics/School Profile
- School Year
- Total Enrollment
- Hispanic/Latino
- American Indian
- Asian
- Black
- Pacific Islander
- White
- 2023-2024
- 13455
- 4354
- 332
- 488
- 362
- 773
- 12309
- 2958
- 5352
- 2022-2023
- 13610
- 4261
- 314
- 480
- 357
- 803
- 12435
- 2864
- 5260
- 2021-2022
- 13618
- 4071
- 321
- 460
- 325
- 810
- 12410
- 2854
- 4985
- 2020-2021
- 13317
- 3982
- 323
- 479
- 308
- 778
- 12125
- 2599
- 4912
- 2019-2020
- 16598
- 4001
- 355
- 499
- 316
- 803
- 15356
- 2810
- 4529
- 2018-2019
- 16165
- 3845
- 301
- 487
- 308
- 741
- 14965
- 2775
- 4680
- 2018-2017
- 15991
- 3809
- 286
- 481
- 264
- 661
- 14854
- 1899
- 6159
- 2017-2016
- 17839
- 4055
- 270
- 492
- 285
- 687
- 16678
- 2428
- 6250
- Principal: Wendy Dau
- Email Wendy Dau

Elementary
Amelia Earhart
- (801) 370-4630
- Amelia Earhart Website
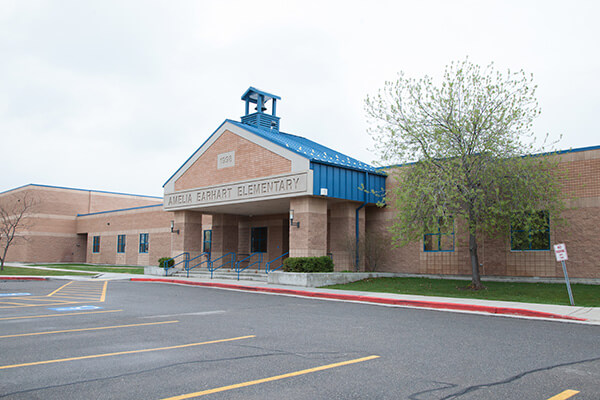
Demographics/School Profile
- School Year
- Total Enrollment
- Hispanic/Latino
- American Indian
- Asian
- Black
- Pacific Islander
- White
- 2023-2024
- 388
- 131
- 13
- 3
- 7
- 16
- 361
- 92
- 233
- 2022-2023
- 419
- 147
- 12
- 5
- 6
- 24
- 385
- 107
- 256
- 2021-2022
- 395
- 139
- 14
- 5
- 10
- 27
- 358
- 115
- 271
- 2020-2021
- 422
- 156
- 18
- 8
- 6
- 29
- 382
- 109
- 237
- 2019-2020
- 484
- 162
- 22
- 7
- 8
- 25
- 445
- 145
- 287
- 2018-2019
- 518
- 173
- 22
- 6
- 5
- 26
- 480
- 160
- 308
- 2017-2018
- 504
- 173
- 12
- 5
- 7
- 22
- 473
- 118
- 327
- 2016-2017
- 532
- 199
- 11
- 4
- 5
- 25
- 493
- 150
- 297
- Feeder Middle School: Dixon
- Feeder High School: Provo High
- Amelia Earhart in District News
- Principal: Ryan McCarty
- Email Ryan McCarty

Canyon Crest
- (801) 221-9873
- Canyon Crest Website
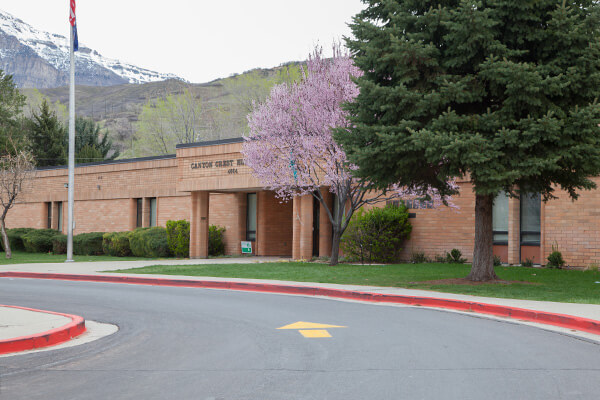
Demographics/School Profile
- School Year
- Total Enrollment
- Hispanic/Latino
- American Indian
- Asian
- Black
- Pacific Islander
- White
- 2023-2024
- 492
- 93
- 11
- 20
- 11
- 14
- 471
- 25
- 99
- 2022-2023
- 474
- 87
- 13
- 27
- 9
- 17
- 456
- 32
- 102
- 2021-2022
- 448
- 70
- 9
- 19
- 2
- 10
- 428
- 37
- 79
- 2020-2021
- 379
- 58
- 5
- 14
- 1
- 11
- 364
- 30
- 76
- 2019-2020
- 476
- 51
- 12
- 15
- 2
- 14
- 459
- 45
- 100
- 2018-2019
- 503
- 49
- 12
- 22
- 3
- 19
- 478
- 40
- 95
- 2017-2018
- 524
- 49
- 10
- 18
- 4
- 16
- 505
- 36
- 93
- 2016-2017
- 547
- 44
- 9
- 14
- 6
- 22
- 522
- 21
- 94

- Feeder Middle School: Centennial
- Feeder High School: Timpview
- Canyon Crest in District News
- Principal: Sean Edwards
- Email Sean Edwards

Edgemont
- (801) 221-9984
- Edgemont Website
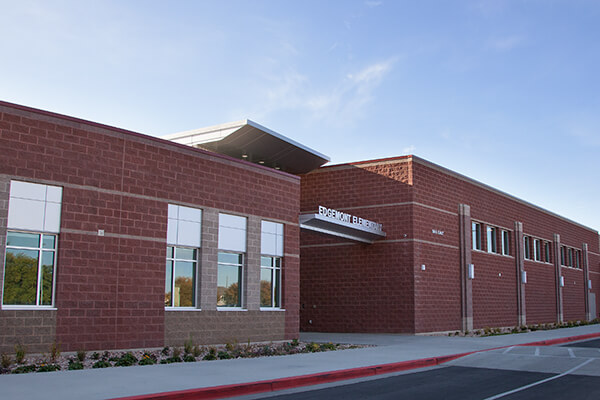
Demographics/School Profile
- School Year
- Total Enrollment
- Hispanic/Latino
- American Indian
- Asian
- Black
- Pacific Islander
- White
- 2023-2024
- 643
- 102
- 10
- 36
- 37
- 28
- 583
- 59
- 143
- 2022-2023
- 630
- 96
- 9
- 35
- 28
- 29
- 579
- 69
- 146
- 2021-2022
- 642
- 84
- 10
- 32
- 26
- 26
- 589
- 67
- 132
- 2020-2021
- 536
- 74
- 9
- 31
- 22
- 25
- 490
- 65
- 107
- 2019-2020
- 631
- 81
- 12
- 28
- 26
- 33
- 574
- 88
- 159
- 2018-2019
- 665
- 75
- 12
- 29
- 19
- 38
- 610
- 95
- 162
- 2017-2018
- 644
- 61
- 10
- 25
- 15
- 31
- 594
- 90
- 194
- 2016-2017
- 626
- 64
- 12
- 29
- 15
- 29
- 568
- 87
- 190

- Feeder Middle School: Centennial
- Feeder High School: Timpview
- Edgemont in District News
- Principal: Harmony Kartchner
- Email Harmony Kartchner

Franklin
- (801) 374-4925
- Franklin Website
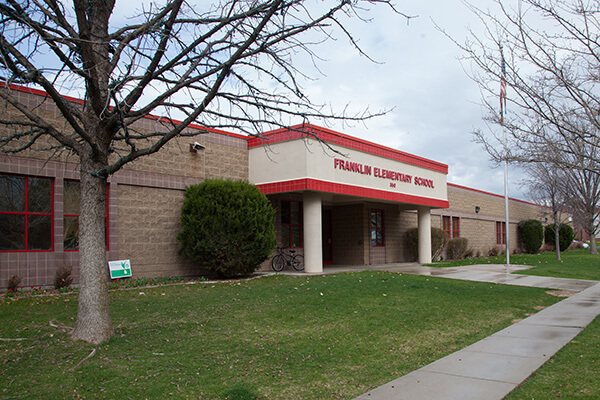
Demographics/School Profile
- School Year
- Total Enrollment
- Hispanic/Latino
- American Indian
- Asian
- Black
- Pacific Islander
- White
- 2023-2024
- 354
- 225
- 10
- 5
- 7
- 19
- 332
- 183
- 261
- 2022-2023
- 336
- 193
- 10
- 10
- 11
- 20
- 304
- 159
- 217
- 2021-2022
- 314
- 170
- 4
- 4
- 10
- 22
- 284
- 178
- 201
- 2020-2021
- 332
- 189
- 13
- 6
- 9
- 27
- 292
- 175
- 235
- 2019-2020
- 349
- 194
- 14
- 7
- 11
- 26
- 310
- 216
- 282
- 2018-2019
- 383
- 209
- 10
- 6
- 14
- 16
- 346
- 211
- 316
- 2017-2018
- 407
- 234
- 13
- 6
- 17
- 17
- 370
- 231
- 349
- 2016-2017
- 450
- 252
- 14
- 6
- 16
- 17
- 418
- 221
- 364

- Feeder Middle School: Dixon
- Feeder High School: Provo High
- Franklin in District News
- Principal: Jason Benson
- Email Jason Benson

Lakeview
- (801) 374-4990
- Lakeview Website
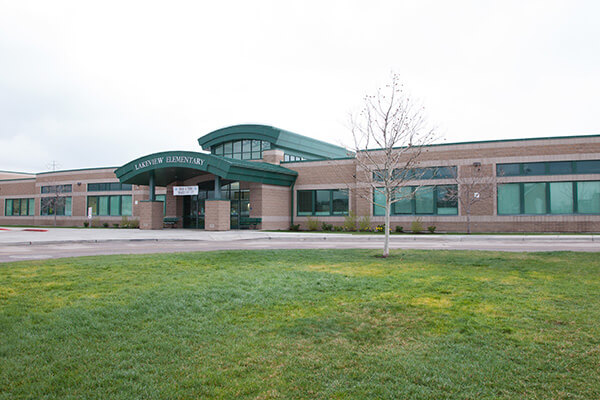
Demographics/School Profile
- School Year
- Total Enrollment
- Hispanic/Latino
- American Indian
- Asian
- Black
- Pacific Islander
- White
- 2023-2024
- 692
- 228
- 14
- 18
- 22
- 37
- 639
- 148
- 254
- 2022-2023
- 689
- 222
- 12
- 18
- 18
- 43
- 637
- 153
- 235
- 2021-2022
- 711
- 200
- 9
- 20
- 15
- 47
- 653
- 154
- 205
- 2020-2021
- 667
- 172
- 5
- 18
- 13
- 46
- 612
- 138
- 190
- 2019-2020
- 790
- 199
- 7
- 18
- 15
- 44
- 738
- 178
- 271
- 2018-2019
- 823
- 183
- 8
- 18
- 17
- 38
- 772
- 173
- 307
- 2017-2018
- 816
- 170
- 4
- 14
- 14
- 32
- 774
- 157
- 229
- 2016-2017
- 754
- 168
- 2
- 14
- 11
- 27
- 719
- 133
- 267

- Feeder Middle School: Dixon
- Feeder High School: Provo High
- Lakeview in District News
- Principal: Jaime Davis-Leite
- Email Jaime Davis-Leite

Provo Peaks
- (801) 374-4940
- Provo Peaks Website
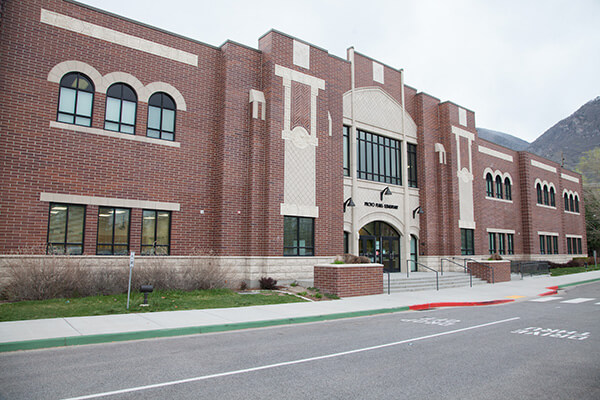
Demographics/School Profile
- School Year
- Total Enrollment
- Hispanic/Latino
- American Indian
- Asian
- Black
- Pacific Islander
- White
- 2023-2424
- 508
- 231
- 28
- 29
- 32
- 23
- 429
- 170
- 316
- 2022-2023
- 518
- 208
- 25
- 25
- 25
- 21
- 454
- 162
- 314
- 2021-2022
- 495
- 195
- 24
- 23
- 23
- 20
- 436
- 157
- 270
- 2020-2021
- 473
- 201
- 22
- 23
- 17
- 13
- 421
- 156
- 270
- 2019-2020
- 495
- 208
- 24
- 23
- 16
- 15
- 442
- 185
- 309
- 2018-2019
- 504
- 199
- 28
- 22
- 10
- 20
- 453
- 166
- 317
- 2017-2018
- 546
- 221
- 33
- 17
- 9
- 13
- 501
- 166
- 381
- 2016-2017
- 517
- 249
- 19
- 13
- 4
- 23
- 528
- 175
- 390

- Feeder Middle School: Centennial
- Feeder High School: Timpview
- Provo Peaks in District News
- Principal: Mark Burge
- Email Mark Burge

Provost
- (801) 374-4960
- Provost Website
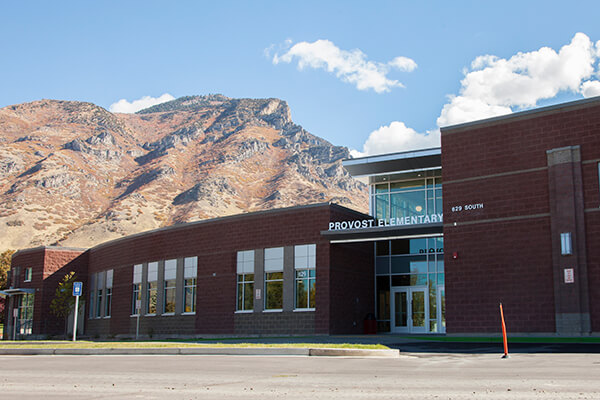
Demographics/School Profile
- School Year
- Total Enrollment
- Hispanic/Latino
- American Indian
- Asian
- Black
- Pacific Islander
- White
- 2023-2024
- 482
- 169
- 10
- 12
- 10
- 33
- 448
- 120
- 237
- 2022-2023
- 470
- 166
- 11
- 11
- 13
- 32
- 433
- 117
- 226
- 2021-2022
- 472
- 170
- 9
- 14
- 6
- 29
- 435
- 134
- 246
- 2020-2021
- 416
- 145
- 7
- 15
- 9
- 24
- 382
- 116
- 216
- 2019-2020
- 464
- 157
- 8
- 9
- 15
- 25
- 429
- 141
- 277
- 2018-2019
- 465
- 137
- 6
- 8
- 10
- 19
- 434
- 115
- 245
- 2017-2018
- 444
- 141
- 5
- 8
- 7
- 15
- 419
- 121
- 269
- 2016-2017
- 472
- 144
- 10
- 6
- 13
- 18
- 435
- 103
- 265

- Feeder Middle School: Centennial
- Feeder High School: Timpview
- Provost in District News
- Principal: Tricia Biggs
- Email Tricia Biggs

Rock Canyon
- (801) 374-4935
- Rock Canyon Website
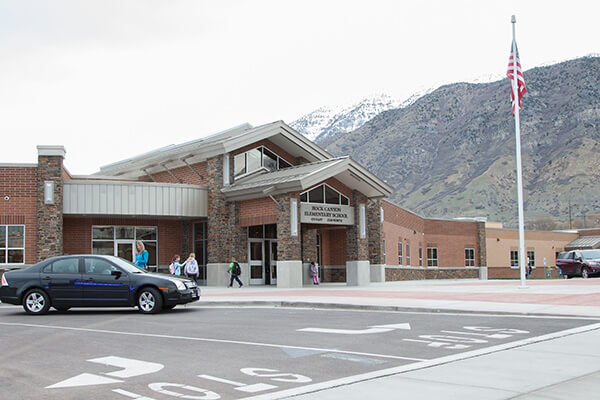
Demographics/School Profile
- School Year
- Total Enrollment
- Hispanic/Latino
- American Indian
- Asian
- Black
- Pacific Islander
- White
- 2023-2024
- 487
- 63
- 9
- 16
- 11
- 18
- 452
- 52
- 111
- 2022-2023
- 530
- 60
- 8
- 14
- 14
- 18
- 496
- 54
- 131
- 2021-2022
- 540
- 58
- 6
- 14
- 18
- 16
- 505
- 59
- 138
- 2020-2021
- 515
- 53
- 6
- 16
- 11
- 22
- 497
- 48
- 131
- 2019-2020
- 589
- 73
- 9
- 19
- 13
- 27
- 551
- 65
- 169
- 2018-2019
- 583
- 43
- 8
- 23
- 16
- 29
- 537
- 54
- 165
- 2017-2018
- 591
- 54
- 4
- 23
- 10
- 29
- 543
- 58
- 214
- 2016-2017
- 623
- 53
- 5
- 26
- 11
- 26
- 575
- 50
- 170

- Feeder Middle School: Centennial
- Feeder High School: Timpview
- Rock Canyon in District News
- Principal: Seth Hansen
- Email Seth Hansen

Spring Creek
- (801) 370-4650
- Spring Creek Website

Demographics/School Profile
- School Year
- Total Enrollment
- Hispanic/Latino
- American Indian
- Asian
- Black
- Pacific Islander
- White
- 2023-2024
- 415
- 210
- 10
- 12
- 13
- 48
- 362
- 163
- 284
- 2022-2023
- 423
- 215
- 8
- 13
- 12
- 47
- 369
- 175
- 263
- 2021-2022
- 412
- 206
- 11
- 8
- 7
- 55
- 356
- 185
- 259
- 2020-2021
- 382
- 204
- 8
- 7
- 7
- 52
- 331
- 182
- 258
- 2019-2020
- 401
- 225
- 9
- 7
- 13
- 49
- 348
- 213
- 340
- 2018-2019
- 411
- 213
- 7
- 8
- 11
- 44
- 363
- 214
- 327
- 2017-2018
- 418
- 228
- 13
- 9
- 9
- 50
- 362
- 209
- 359
- 2016-2017
- 476
- 250
- 10
- 11
- 5
- 41
- 431
- 220
- 351

- Feeder Middle School: Centennial
- Feeder High School: Timpview
- Spring Creek in District News
- Principal: Ruth Ann Snow
- Email Ruth Ann Snow

Sunset View
- (801) 374-4950
- Sunset View Website
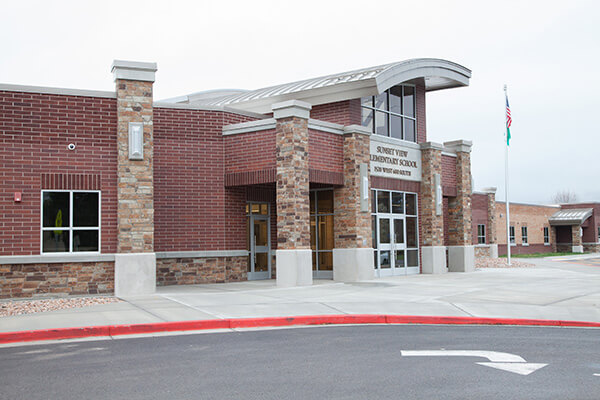
Demographics/School Profile
- School Year
- Total Enrollment
- Hispanic/Latino
- American Indian
- Asian
- Black
- Pacific Islander
- White
- 2023-2024
- 572
- 204
- 20
- 20
- 18
- 51
- 516
- 136
- 294
- 2022-2023
- 546
- 215
- 14
- 15
- 21
- 49
- 486
- 150
- 274
- 2021-2022
- 551
- 225
- 12
- 9
- 14
- 35
- 508
- 170
- 259
- 2020-2021
- 526
- 204
- 16
- 5
- 20
- 42
- 474
- 157
- 273
- 2019-2020
- 583
- 234
- 15
- 11
- 18
- 50
- 524
- 204
- 340
- 2018-2019
- 546
- 201
- 8
- 10
- 16
- 41
- 494
- 188
- 306
- 2017-2018
- 569
- 211
- 10
- 11
- 10
- 36
- 524
- 191
- 351
- 2016-2017
- 561
- 234
- 7
- 10
- 11
- 34
- 520
- 183
- 356

- Feeder Middle School: Dixon
- Feeder High School: Provo High
- Sunset View in District News
- Principal: Chris Chilcoat
- Email Chris Chilcoat

Timpanogos
- (801) 374-4955
- Timpanogos Website

Demographics/School Profile
- School Year
- Total Enrollment
- Hispanic/Latino
- American Indian
- Asian
- Black
- Pacific Islander
- White
- 2023-2024
- 605
- 346
- 21
- 13
- 27
- 16
- 563
- 265
- 371
- 2022-2023
- 622
- 345
- 23
- 18
- 31
- 27
- 566
- 291
- 395
- 2021-2022
- 586
- 320
- 24
- 18
- 27
- 18
- 538
- 304
- 362
- 2020-2021
- 565
- 322
- 23
- 12
- 23
- 13
- 523
- 283
- 376
- 2019-2020
- 629
- 353
- 28
- 11
- 16
- 18
- 585
- 367
- 452
- 2018-2019
- 629
- 300
- 22
- 14
- 17
- 29
- 577
- 326
- 452
- 2017-2018
- 649
- 330
- 27
- 12
- 17
- 27
- 592
- 330
- 527
- 2016-2017
- 668
- 365
- 30
- 11
- 23
- 20
- 616
- 310
- 512

- Feeder Middle School: Dixon
- Feeder High School: Provo High
- Timpanogos in District News
- Principal: Carrie Rawlins
- Email Carrie Rawlins

Wasatch
- (801) 374-4910
- Wasatch Website
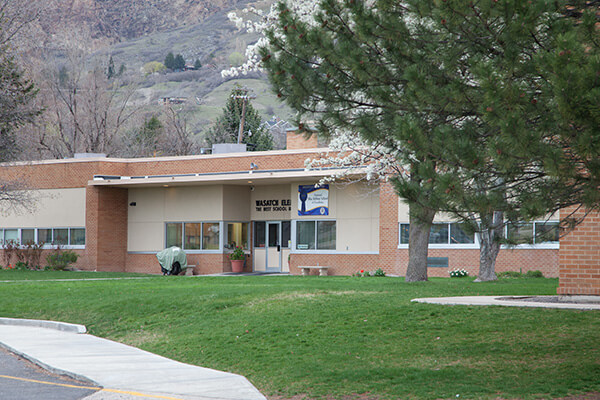
Demographics/School Profile
- School Year
- Total Enrollment
- Hispanic/Latino
- American Indian
- Asian
- Black
- Pacific Islander
- White
- 2023-2024
- 583
- 77
- 11
- 59
- 12
- 28
- 532
- 72
- 158
- 2022-2023
- 610
- 76
- 9
- 50
- 11
- 25
- 564
- 71
- 133
- 2021-2022
- 644
- 72
- 14
- 49
- 10
- 29
- 586
- 73
- 122
- 2020-2021
- 623
- 61
- 11
- 57
- 12
- 28
- 565
- 66
- 139
- 2019-2020
- 744
- 79
- 6
- 71
- 9
- 34
- 677
- 105
- 173
- 2018-2019
- 799
- 70
- 5
- 61
- 12
- 24
- 742
- 97
- 167
- 2017-2018
- 883
- 72
- 5
- 76
- 18
- 24
- 815
- 97
- 211
- 2016-2017
- 892
- 87
- 10
- 76
- 15
- 25
- 816
- 94
- 188

- Feeder Middle School: Centennial
- Feeder High School: Timpview
- Wasatch in District News
- Principal: Chris Fuhriman
- Email Chris Fuhriman

Westridge
- (801) 374-4870
- Westridge Website

Demographics/School Profile
- School Year
- Total Enrollment
- Hispanic/Latino
- American Indian
- Asian
- Black
- Pacific Islander
- White
- 2023-2024
- 612
- 130
- 20
- 26
- 20
- 46
- 553
- 87
- 213
- 2022-2023
- 620
- 116
- 22
- 17
- 12
- 46
- 566
- 85
- 212
- 2021-2022
- 614
- 108
- 25
- 20
- 22
- 45
- 556
- 98
- 211
- 2020-2021
- 601
- 101
- 23
- 19
- 18
- 41
- 544
- 78
- 220
- 2019-2020
- 717
- 130
- 21
- 19
- 16
- 46
- 658
- 115
- 289
- 2018-2019
- 730
- 143
- 19
- 18
- 11
- 48
- 675
- 124
- 278
- 2017-2018
- 769
- 132
- 16
- 21
- 14
- 806
- 721
- 114
- 343
- 2016-2017
- 806
- 143
- 11
- 27
- 22
- 55
- 743
- 116
- 358

- Feeder Middle School: Dixon
- Feeder High School: Provo High
- Westridge in District News
- Principal: Kim Hawkins
- Email Kim Hawkins

Middle School
Centennial Middle
- (801) 370-4621
- Centennial Middle Website
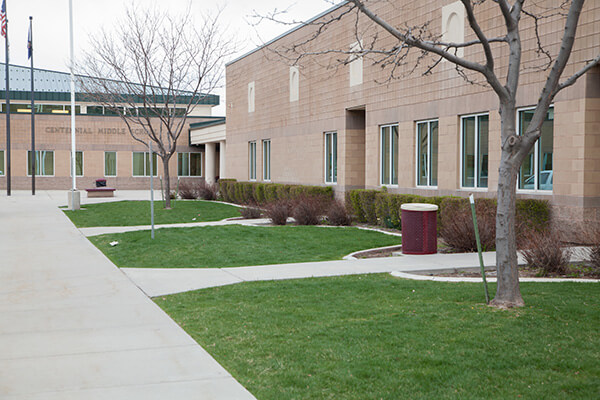
Demographics/School Profile
- School Year
- Total Enrollment
- Hispanic/Latino
- American Indian
- Asian
- Black
- Pacific Islander
- White
- 2023-2024
- 1119
- 301
- 29
- 42
- 30
- 66
- 1009
- 259
- 390
- 2022-2023
- 1099
- 270
- 21
- 43
- 18
- 72
- 1007
- 216
- 364
- 2021-2022
- 1132
- 278
- 13
- 45
- 20
- 74
- 1040
- 212
- 335
- 2020-2021
- 1200
- 298
- 23
- 45
- 24
- 67
- 1111
- 200
- 371
- 2019-2020
- 1238
- 297
- 25
- 42
- 26
- 65
- 1147
- 208
- 448
- 2018-2019
- 1191
- 264
- 18
- 51
- 23
- 57
- 1090
- 169
- 417
- 2017-2018
- 1119
- 232
- 17
- 59
- 18
- 45
- 1022
- 133
- 427
- 2016-2017
- 1103
- 243
- 8
- 47
- 13
- 43
- 978
- 111
- 425

- Feeder High School: Timpview
- Centennial Middle in District News
- Principal: Brookeanne Taylor
- Email Brookeanne Taylor

Dixon Middle
- (801) 374-4980
- Dixon Middle Website
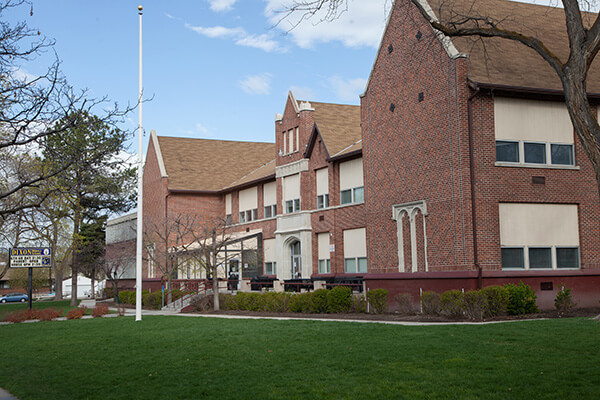
Demographics/School Profile
- School Year
- Total Enrollment
- Hispanic/Latino
- American Indian
- Asian
- Black
- Pacific Islander
- White
- 2023-2024
- 883
- 335
- 21
- 17
- 17
- 55
- 818
- 274
- 434
- 2022-2023
- 937
- 358
- 26
- 18
- 27
- 50
- 872
- 297
- 431
- 2021-2022
- 922
- 340
- 30
- 16
- 22
- 48
- 855
- 267
- 405
- 2020-2021
- 928
- 346
- 27
- 15
- 22
- 48
- 853
- 218
- 426
- 2019-2020
- 988
- 358
- 20
- 22
- 18
- 54
- 910
- 260
- 502
- 2018-2019
- 882
- 319
- 13
- 16
- 21
- 43
- 819
- 200
- 435
- 2017-2018
- 835
- 300
- 17
- 8
- 16
- 43
- 769
- 138
- 467
- 2016-2017
- 869
- 298
- 26
- 8
- 11
- 42
- 803
- 138
- 436

- Feeder High School: Provo High
- Dixon Middle in District News
- Principal: John Anderson
- Email John Anderson

High School
Independence High
- (801) 370-4614
- Independence High Website

Demographics/School Profile
- School Year
- Total Enrollment
- Hispanic/Latino
- American Indian
- Asian
- Black
- Pacific Islander
- White
- 2023-2024
- 278
- 138
- 11
- 5
- 7
- 13
- 252
- 72
- 162
- 2022-2023
- 273
- 144
- 14
- 4
- 11
- 9
- 244
- 62
- 120
- 2021-2022
- 253
- 114
- 11
- 1
- 7
- 8
- 231
- 73
- 253
- 2020-2021
- 184
- 73
- 11
- 2
- 9
- 5
- 162
- 26
- 104
- 2019-2020
- 189
- 73
- 5
- 3
- 4
- 7
- 172
- 41
- 106
- 2018-2019
- 200
- 77
- 6
- 2
- 4
- 7
- 182
- 25
- 94
- 2017-2018
- 189
- 70
- 3
- 2
- 5
- 4
- 176
- 19
- 119
- 2016-2017
- 285
- 120
- 8
- 4
- 8
- 12
- 258
- 32
- 183

- Feeder Middle School: Dixon
- Feeder High School: Provo High
- Independence High in District News
- Principal: Jacob Griffin
- Email Jacob Griffin

Provo High
- (801)373-6550
- Provo High Website
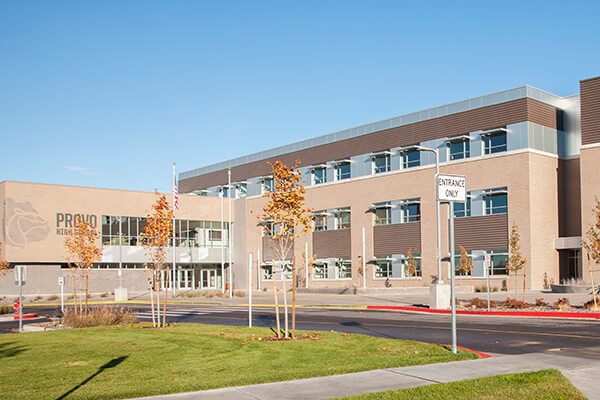
Demographics/School Profile
- School Year
- Total Enrollment
- Hispanic/Latino
- American Indian
- Asian
- Black
- Pacific Islander
- White
- 2023-2024
- 1976
- 790
- 48
- 46
- 37
- 110
- 1825
- 434
- 762
- 2022-2023
- 1969
- 758
- 44
- 48
- 46
- 106
- 1805
- 363
- 764
- 2021-2022
- 1963
- 748
- 52
- 45
- 39
- 107
- 1793
- 335
- 648
- 2020-2021
- 1931
- 722
- 51
- 42
- 31
- 101
- 1773
- 280
- 649
- 2019-2020
- 1912
- 706
- 60
- 45
- 39
- 101
- 1736
- 299
- 825
- 2018-2019
- 1889
- 681
- 45
- 46
- 38
- 88
- 1724
- 262
- 753
- 2017-2018
- 1852
- 641
- 43
- 41
- 24
- 78
- 1702
- 215
- 816
- 2016-2017
- 1901
- 627
- 37
- 47
- 34
- 85
- 1738
- 157
- 736
Timpview High
- (801) 221-9720
- Timpview High Website
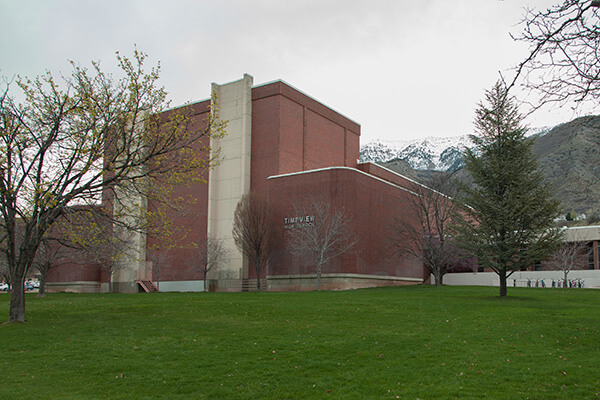
Demographics/School Profile
- School Year
- Total Enrollment
- Hispanic/Latino
- American Indian
- Asian
- Black
- Pacific Islander
- White
- 2023-2024
- 2269
- 547
- 33
- 100
- 41
- 145
- 2078
- 339
- 625
- 2022-2023
- 2337
- 551
- 29
- 101
- 42
- 159
- 2120
- 310
- 671
- 2021-2022
- 2391
- 536
- 39
- 109
- 44
- 185
- 2133
- 294
- 620
- 2020-2021
- 2353
- 515
- 35
- 123
- 39
- 161
- 2115
- 229
- 555
- 2019-2020
- 2269
- 483
- 43
- 108
- 30
- 142
- 2049
- 243
- 698
- 2018-2019
- 2162
- 400
- 31
- 102
- 35
- 126
- 1950
- 167
- 642
- 2017-2018
- 2173
- 416
- 27
- 100
- 31
- 109
- 1047
- 170
- 741
- 2016-2017
- 2114
- 418
- 26
- 102
- 42
- 103
- 1919
- 164
- 633

- Feeder Middle School: Centennial
- Timpview High in District News
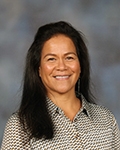
- Principal: Momi Tu'ua
- Email Momi Tu'ua
Specialized School
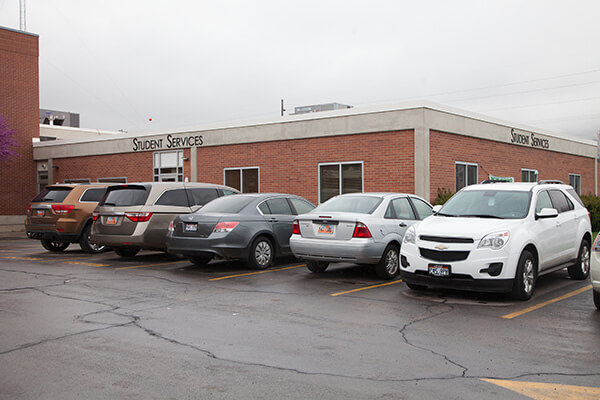
eSchool
- (801) 374-4810
- eSchool Website
Demographics/School Profile
- School Year
- Total Enrollment
- Hispanic/Latino
- American Indian
- Asian
- Black
- Pacific Islander
- White
- Principal: Clint Smith
- Email Clint Smith

Preschools

Demographics/School Profile
- School Year
- Total Enrollment
- Hispanic/Latino
- American Indian
- Asian
- Black
- Pacific Islander
- White
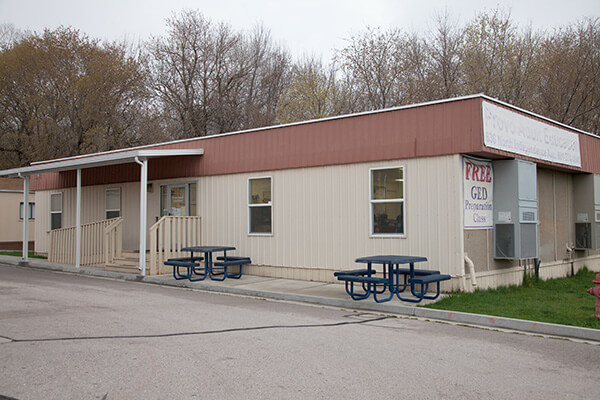
Provo Adult Education
- (801) 374-4840
- Provo Adult Education Website
Demographics/School Profile
- School Year
- Total Enrollment
- Hispanic/Latino
- American Indian
- Asian
- Black
- Pacific Islander
- White
- Principal: Nicki Wake
- Email Nicki Wake

Provo Transition Services/EBPH
- (801) 374-4874
- Provo Transition Services/EBPH Website

Demographics/School Profile
- School Year
- Total Enrollment
- Hispanic/Latino
- American Indian
- Asian
- Black
- Pacific Islander
- White
- Principal: Bret MacCabe
- Email Bret MacCabe

Utah Report Card from Utah State Board of Education - https://datagateway.schools.utah.gov Enrollment, Diversity and ELL pulled from the Annual Statistical Report (S3)
