
May 19, 2025 Employment Vacancies
 July 2nd, 2025
March 12 Asst 4 Custodial/Team Leader: Timpview High School March 13 Inst Asst 3/Extra...
By statute, the Board must be presented the following year’s proposed budget by June 1. The initial budget presentation took place on Tuesday, May 9, 2023. The details of the presentation are included below. The budget hearing and Budget adoption for the 2024 fiscal year is scheduled for Tuesday, June 13th, 2023, during the regularly scheduled Board business meeting.
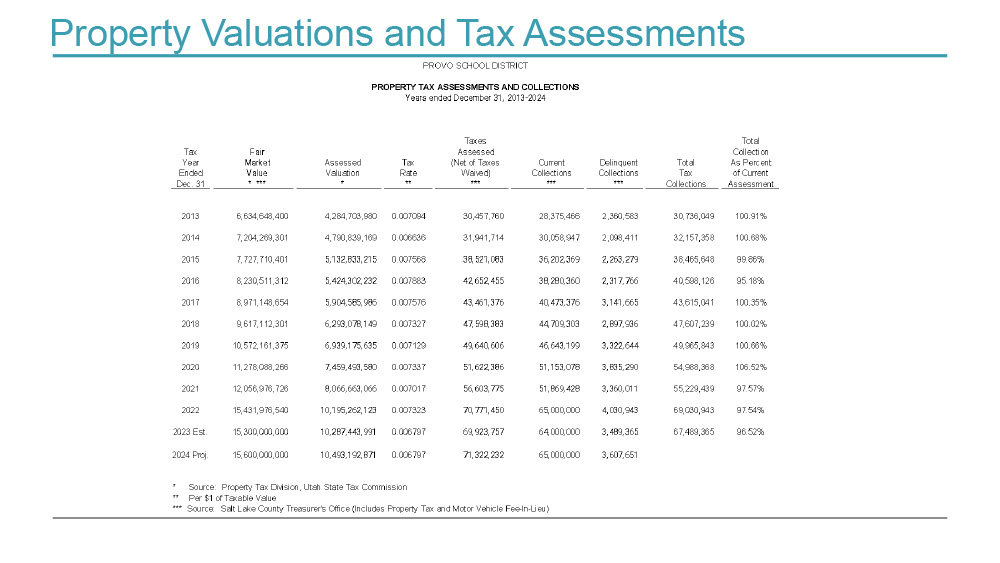
Property Valuations and Tax Assessments – a historical look at Fair market value and the tax rates from 2013 to the projected total in 2024.
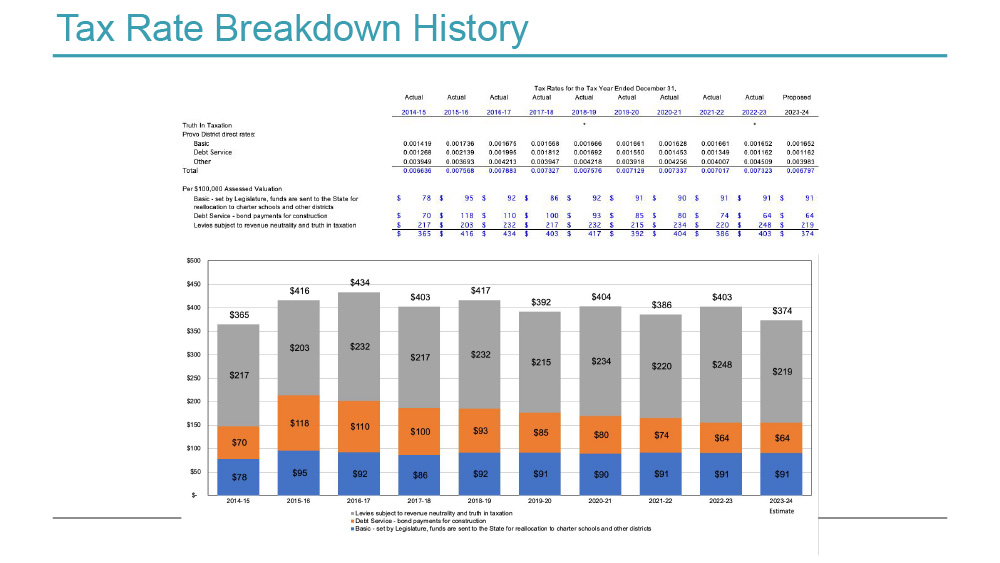
Tax Rate Breakdown History – a look at tax rates by levy type and the amount of tax based on each $100,000 of home value
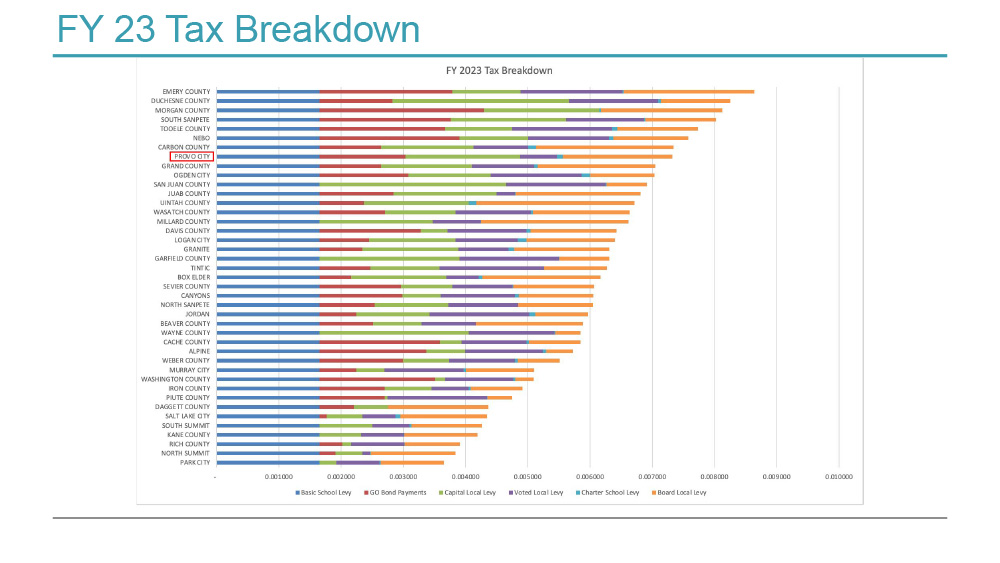
FY23 Tax Breakdown – a list of the tax levies and all districts in the state of Utah
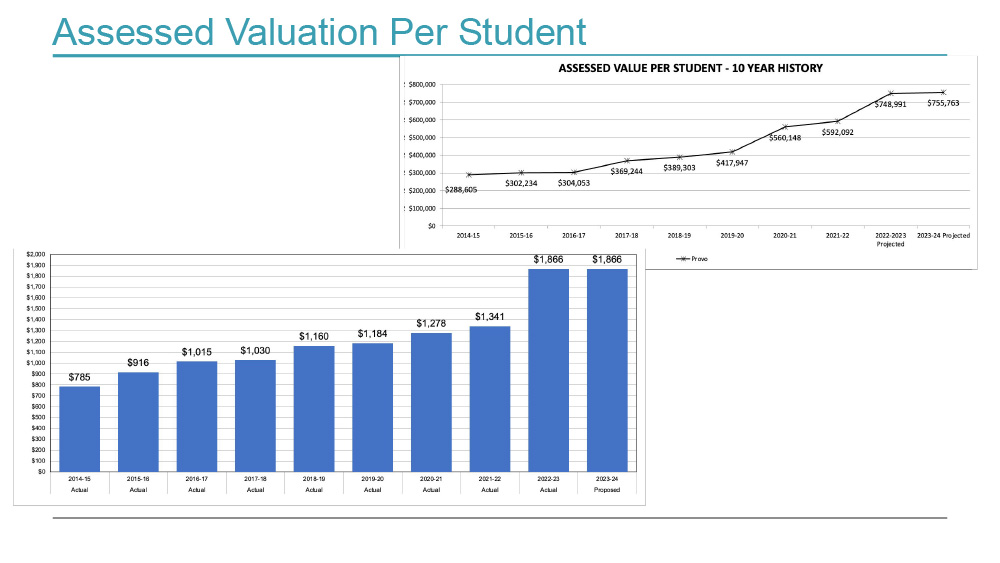
Assessed Valuation Per Student – a graph showing the assessed valuation per student in the District and the amount of tax budgeted by student.
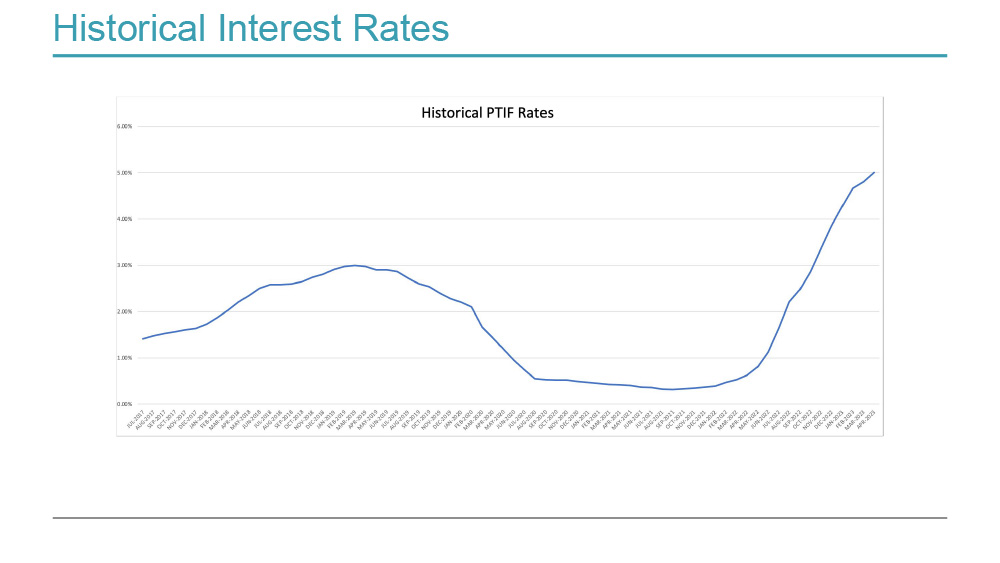
Historical Interest Rates – a graph showing Public Treasurers Investment Fund rates from 2017 through April 2023.
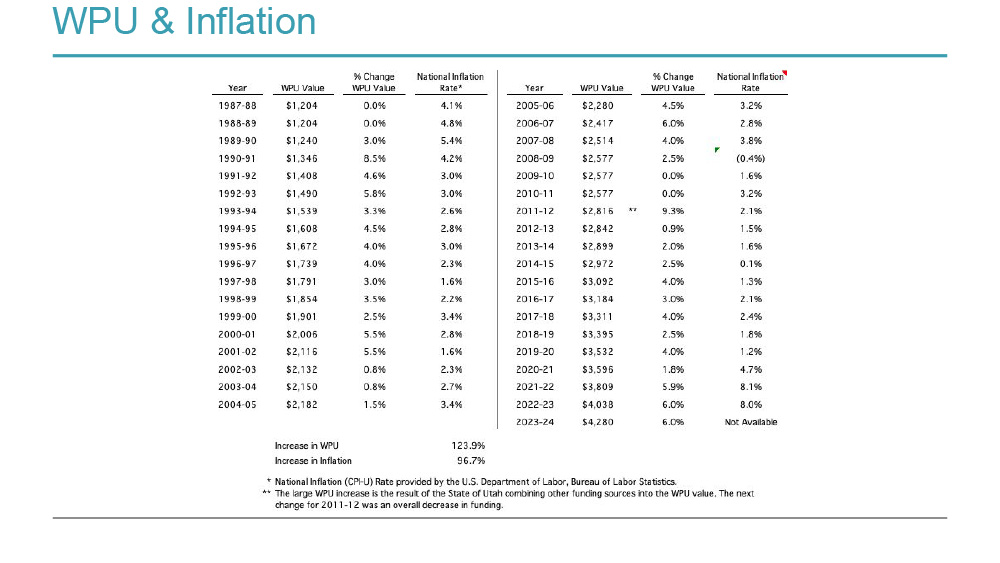
WPU & Inflation – a table showing the dollar amount of the WPU from 1987 through 2023 and the national inflation rate in the same time period.
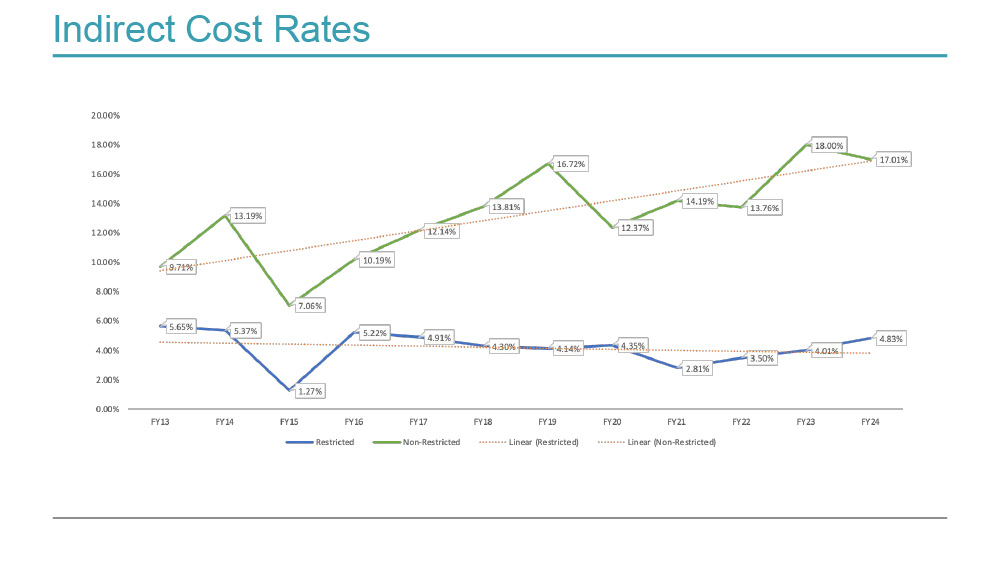
Indirect Cost Rates – a graph showing the restricted and non-restricted indirect costs rates applied to state and federal grants.
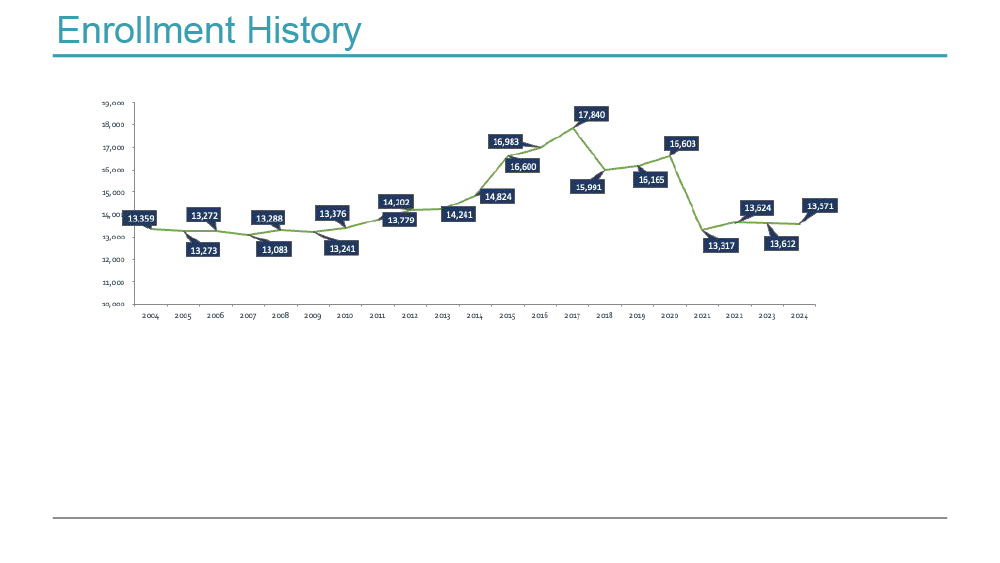
Enrollment history – a graph showing the enrollment history for the District from 2004 through the projected total in 2024.
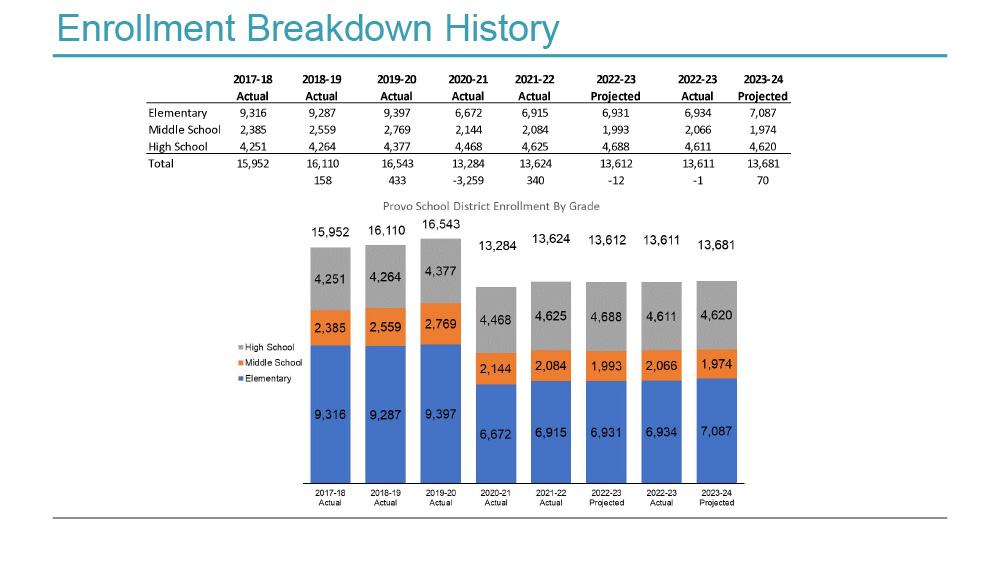
Enrollment Breakdown History – a graph and table showing the breakdown of enrollment between elementary, middle school and high school from 2017 through the projected 2024 total
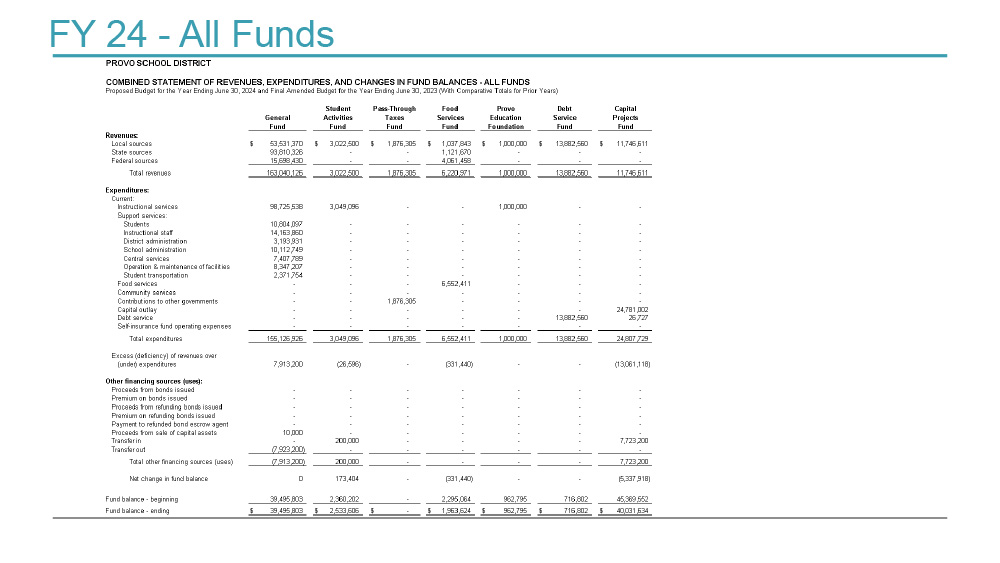
FY24 – All Funds – a spreadsheet showing the total budget in Fiscal Year 2024 for the General Fund, the Student Activities Fund, Pass-Through Taxes Fund, Food Services Fund, Provo Education Fund, Debt Service Fund, Capital Projects Fund
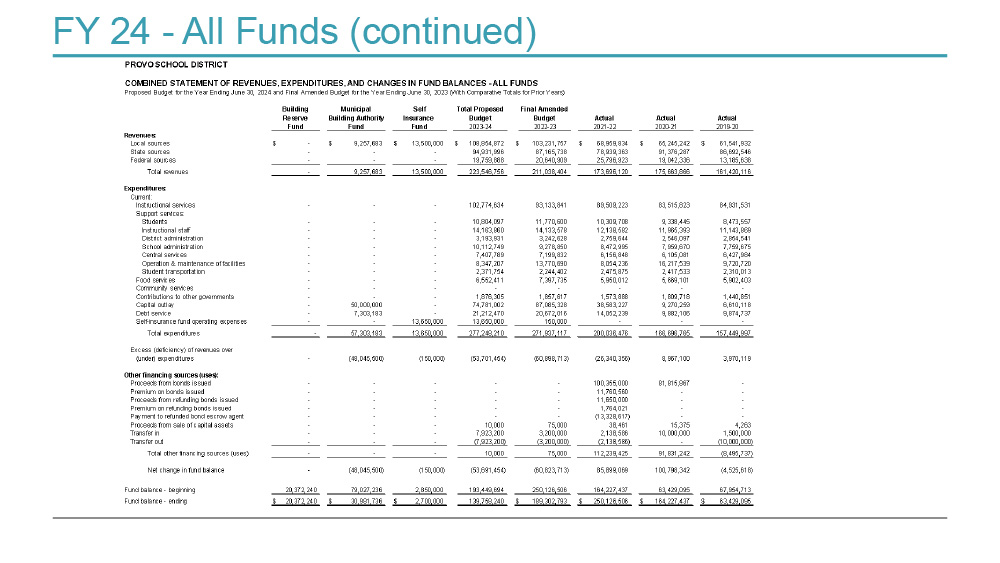
FY24 – All Funds – a continuation of the prior page spreadsheet that includes budget for Fiscal Year 2024 for the Building Reserve Fund, Municipal Building Authority Fund, the Self Insurance Fund and the total combined fiscal year 2024 budget for all funds, along with the final budget amended budget for Fiscal Year 2023 and the actuals from the three prior fiscal years.
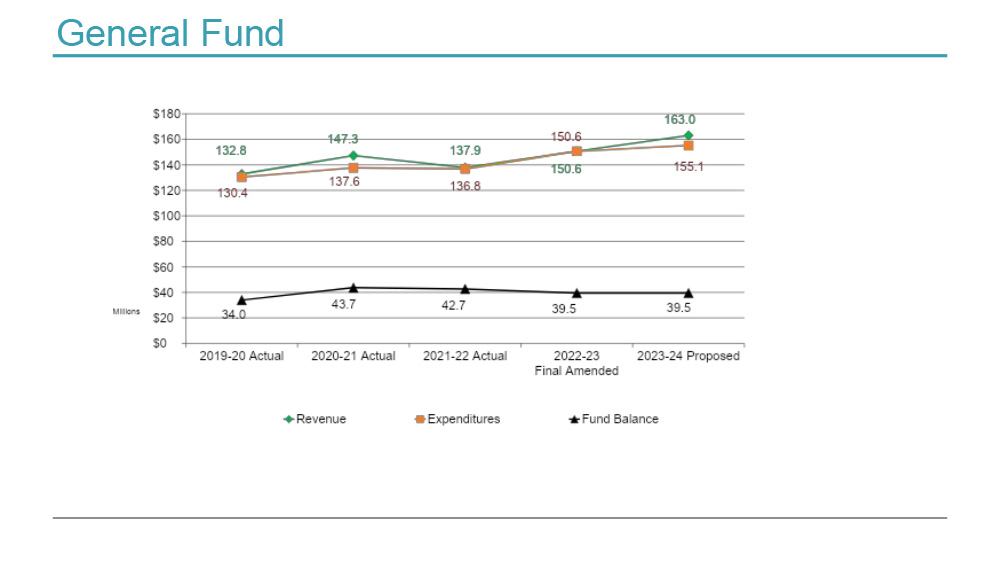
General Fund – a graphical representation of the revenue, expenditures and fund balance for 2019 through 2024
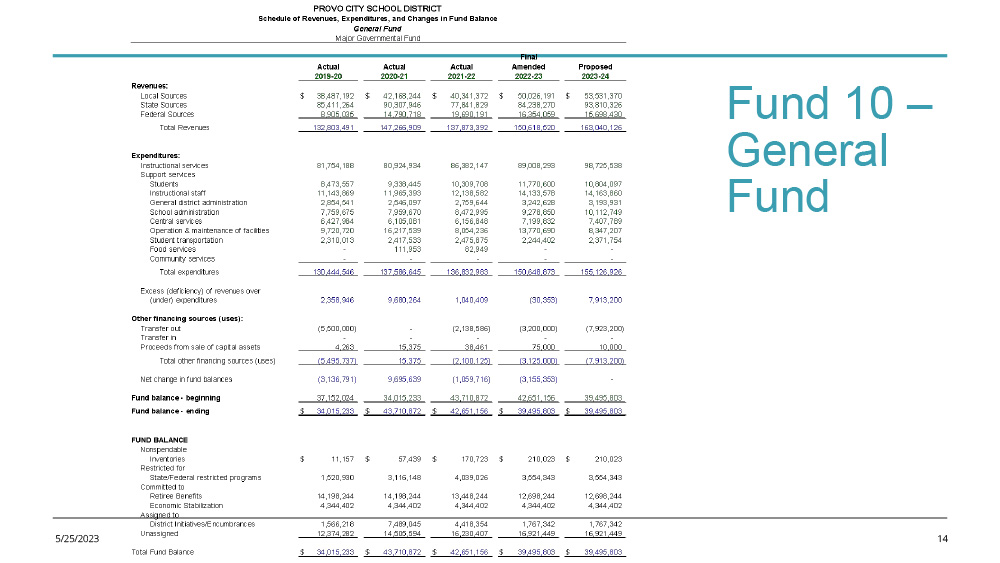
Fund 10 – General Fund – The schedule of revenues, expenditures and changes in fund balance for the General Fund for 2019 through 2024.
Fund 10 – Charts – a pie chart breaking down the differences between revenue types.
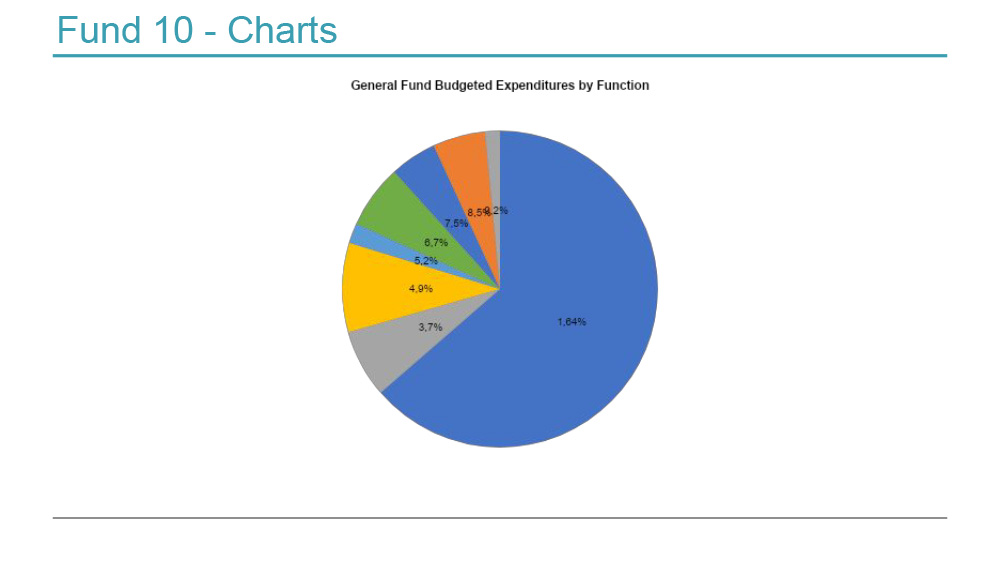
Fund 10 – Charts – a pie chart breaking down expenditures between functions
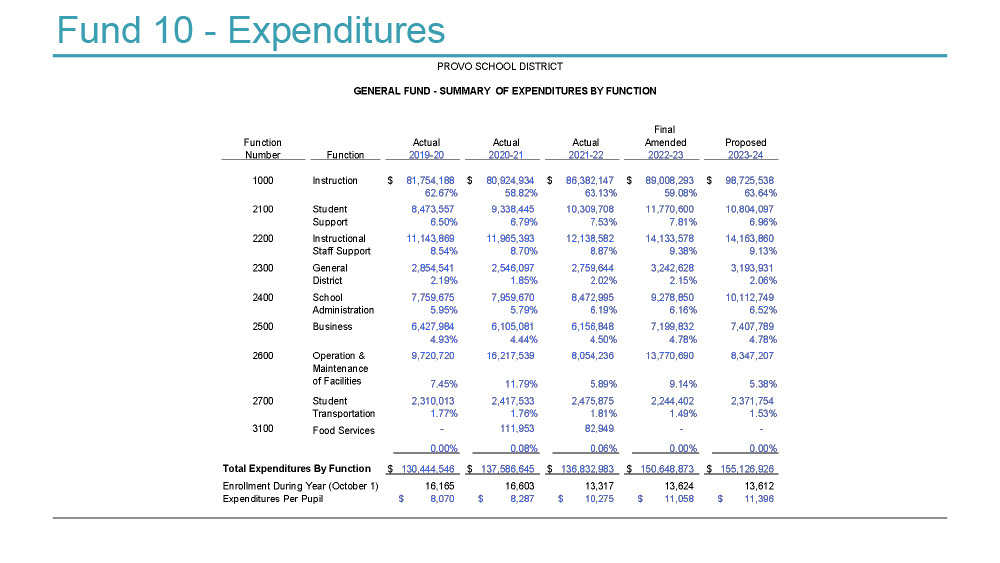
Fund 10 – Expenditures – a table showing summary of expenditures by function – showing percentages per function
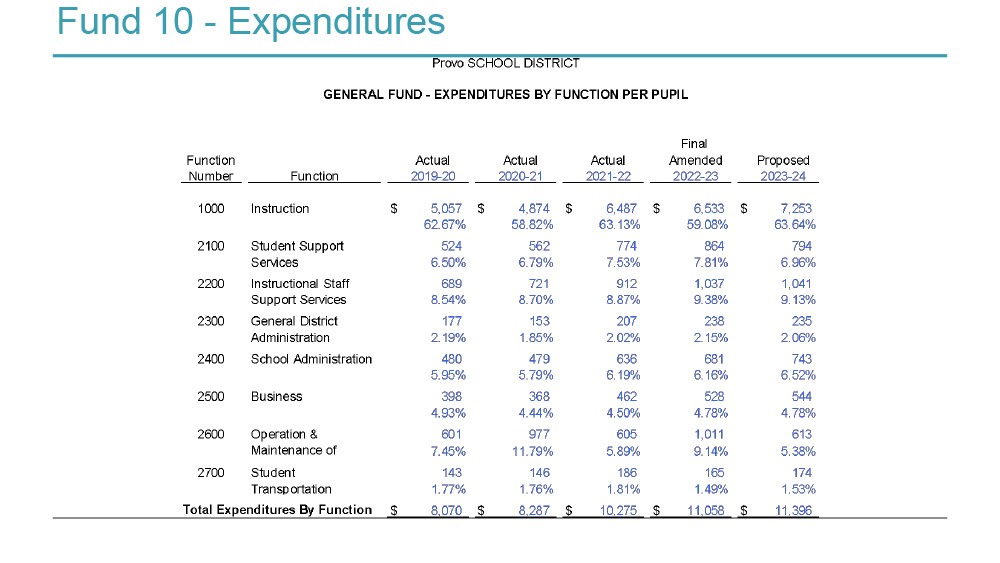
Fund 10 – Expenditures – a table showing the expenditures by function per student enrolled in the district

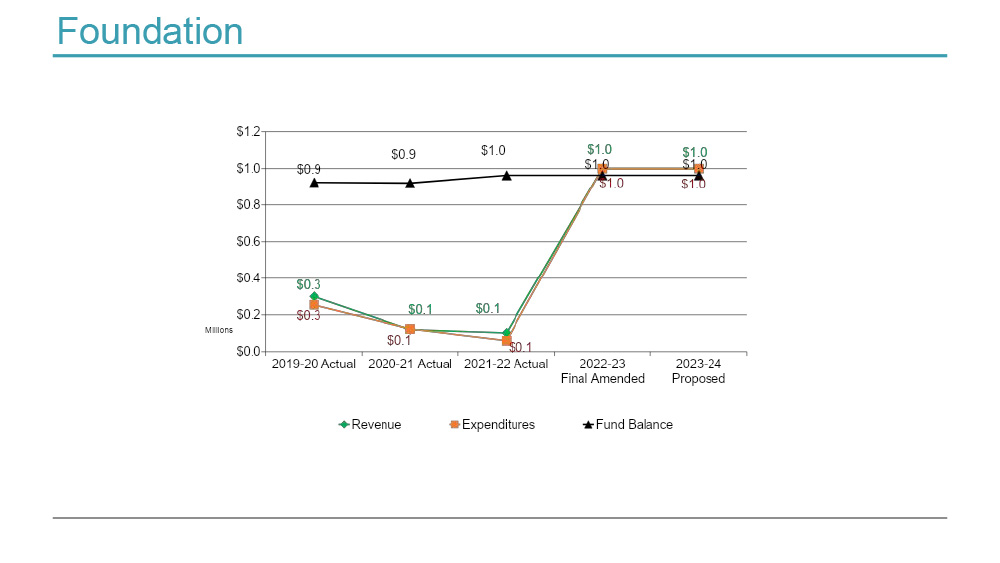
Foundation – a graph showing the revenue, expenditures and fund balance for the Foundation
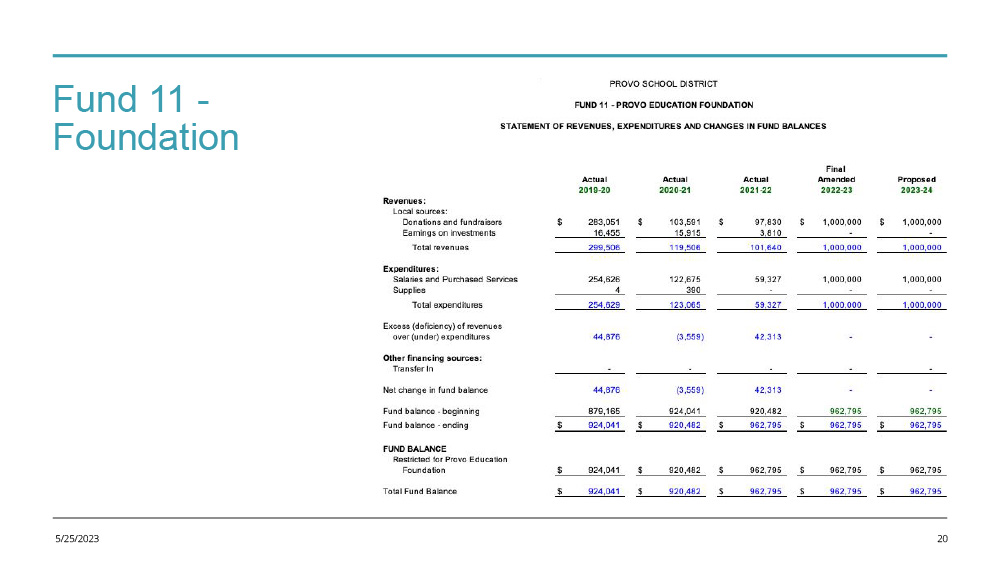
Fund 11- Foundation – The schedule of revenues, expenditures and changes in fund balance for the Foundation for 2019 through 2024.
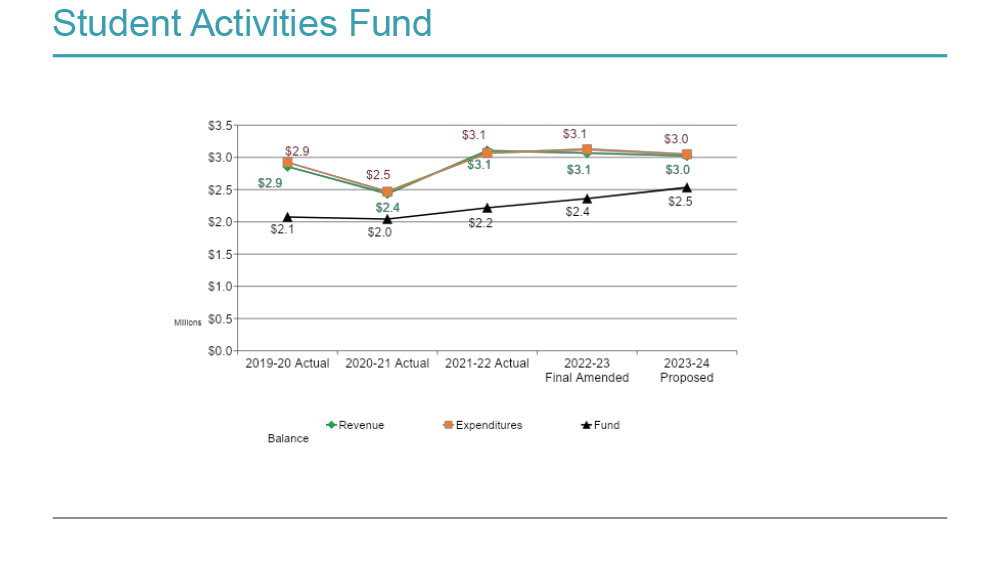
Student Activities Fund – a graph showing the revenue, expenditures and fund balance
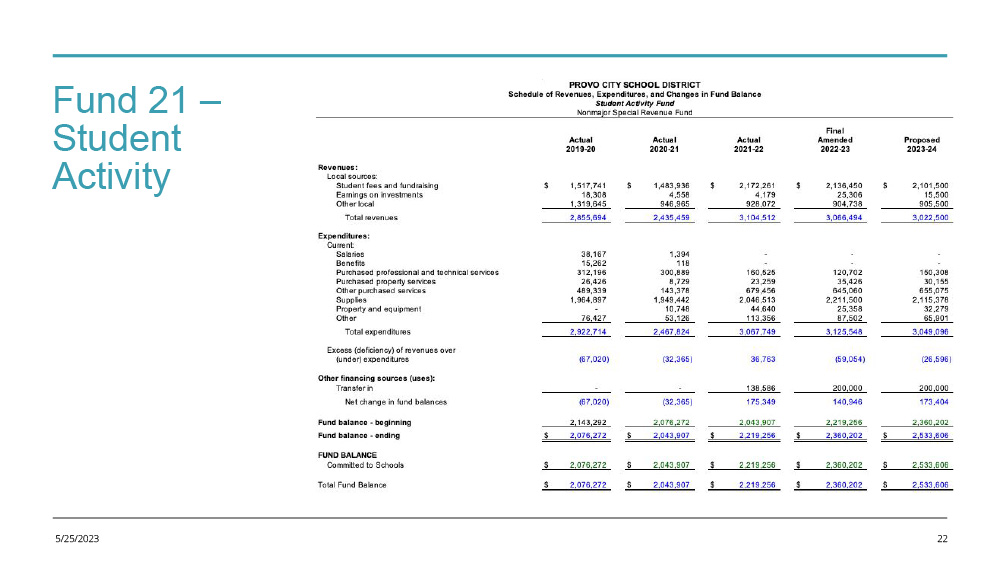
Fund 21 – Student Activity – The schedule of revenues, expenditures and changes in fund balance for the Student Activity Fund for 2019 through 2024.
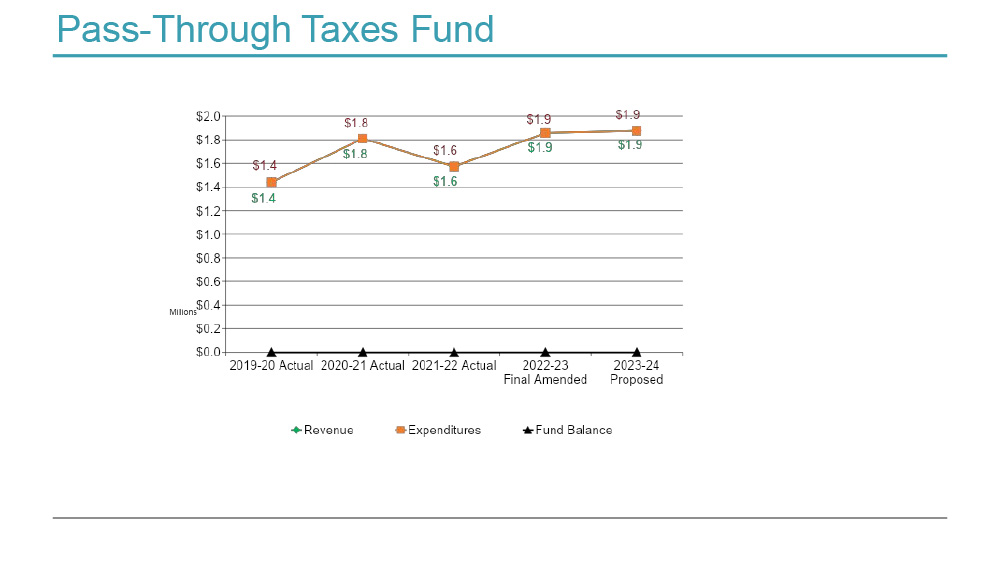
Pass-Through Taxes Fund – a graph showing the revenue, expenditures and fund balance
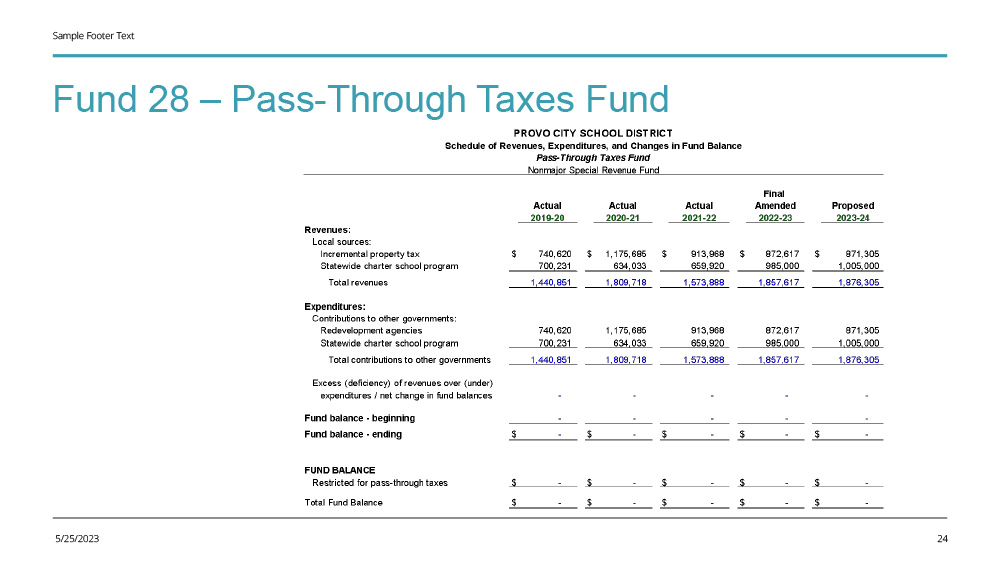
Fund 28 – Pass-Through Taxes Fund – The schedule of revenues, expenditures and changes in fund balance for the Pass Through Taxes Fund for 2019 through 2024.
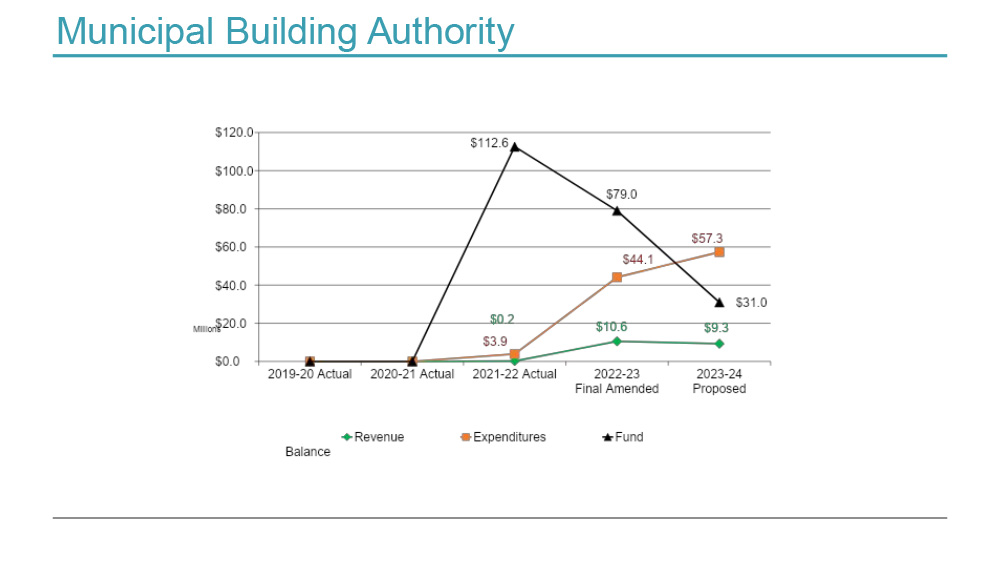
Municipal Building Authority – a graph showing the revenue, expenditures and fund balance
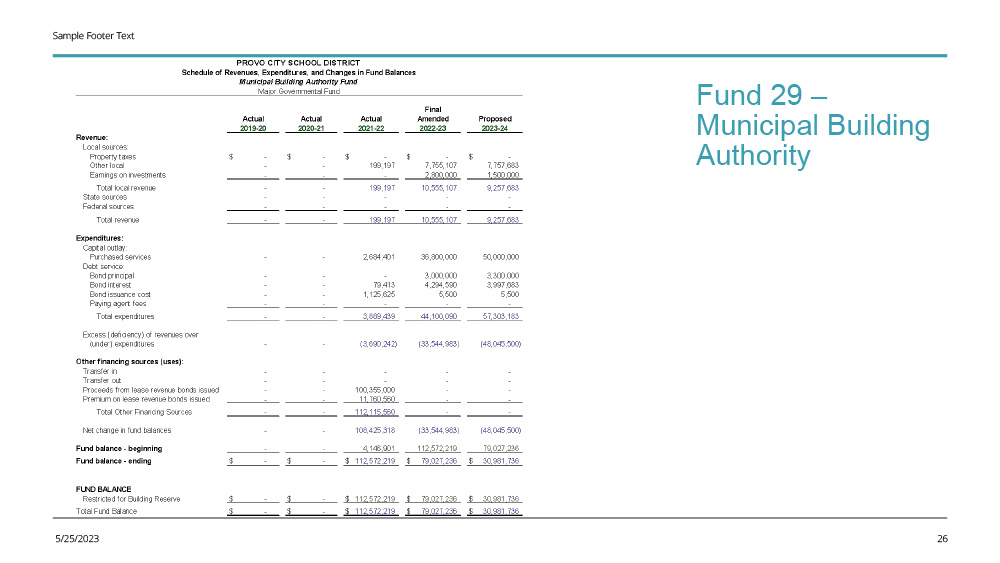
Fund 29 – Municipal Building Authority – The schedule of revenues, expenditures and changes in fund balance for the Municipal Building Authority Fund for 2019 through 2024.
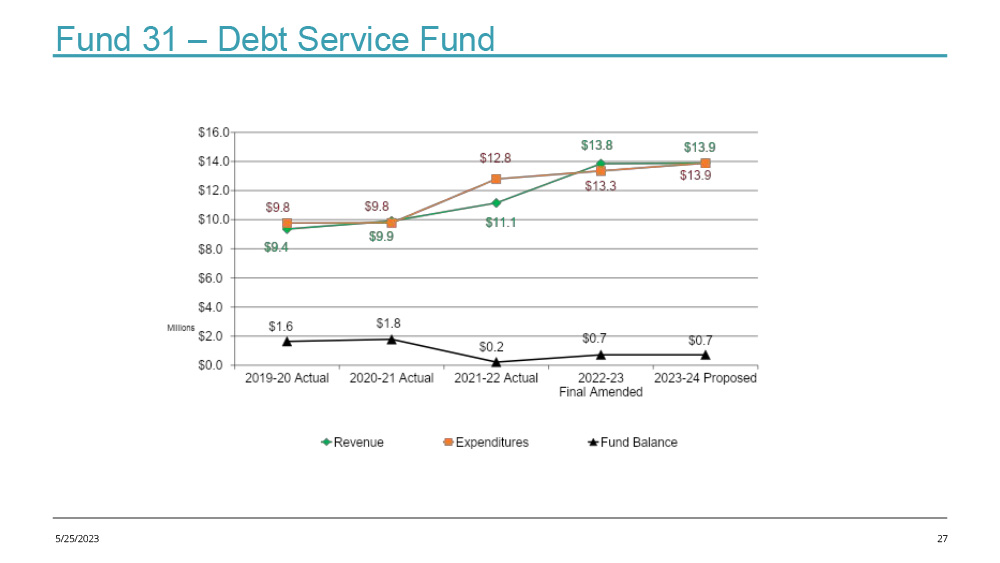
Debt Service Fund – a graph showing the revenue, expenditures and fund balance
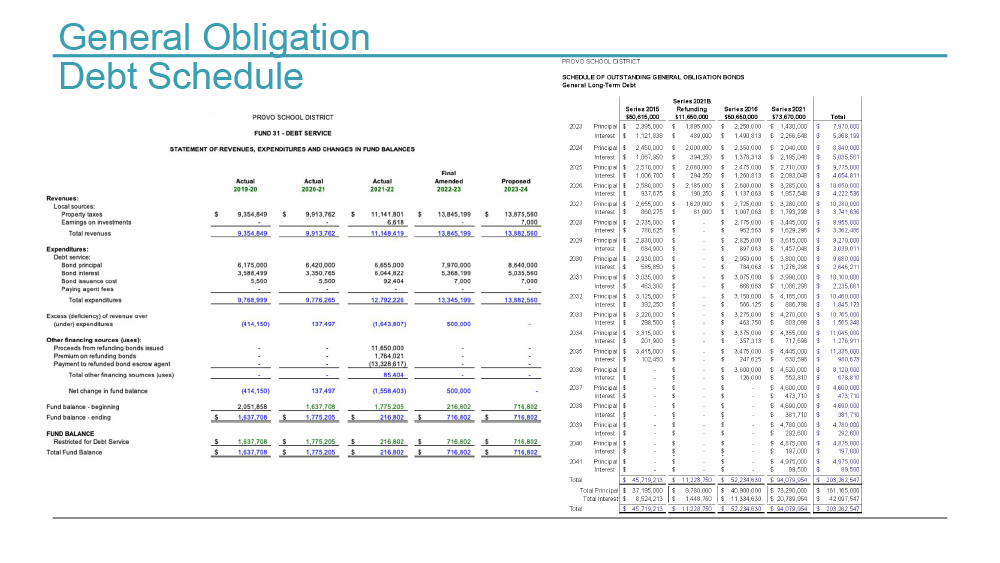
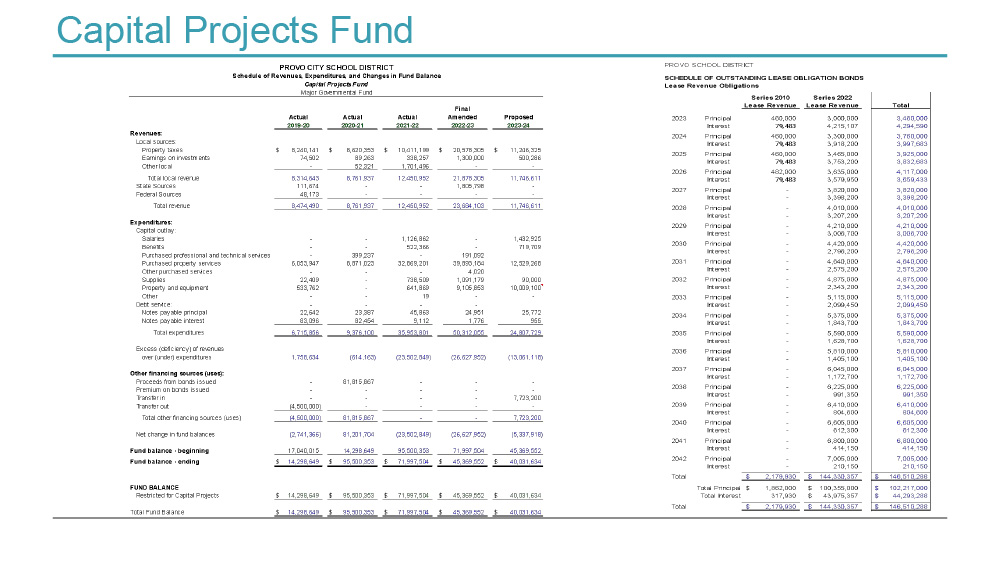
General Obligation Debt Schedule – The schedule of revenues, expenditures and changes in fund balance for the Debt Service Fund for 2019 through 2024 and the schedule of outstanding general obligation bonds
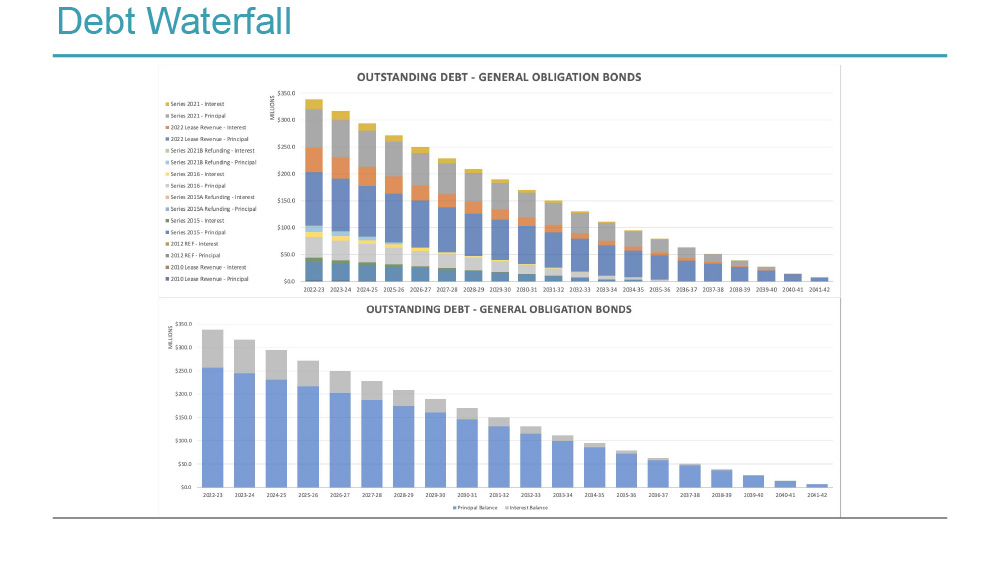
Debt Waterfall – Graph showing the debt owing over the next 20 years
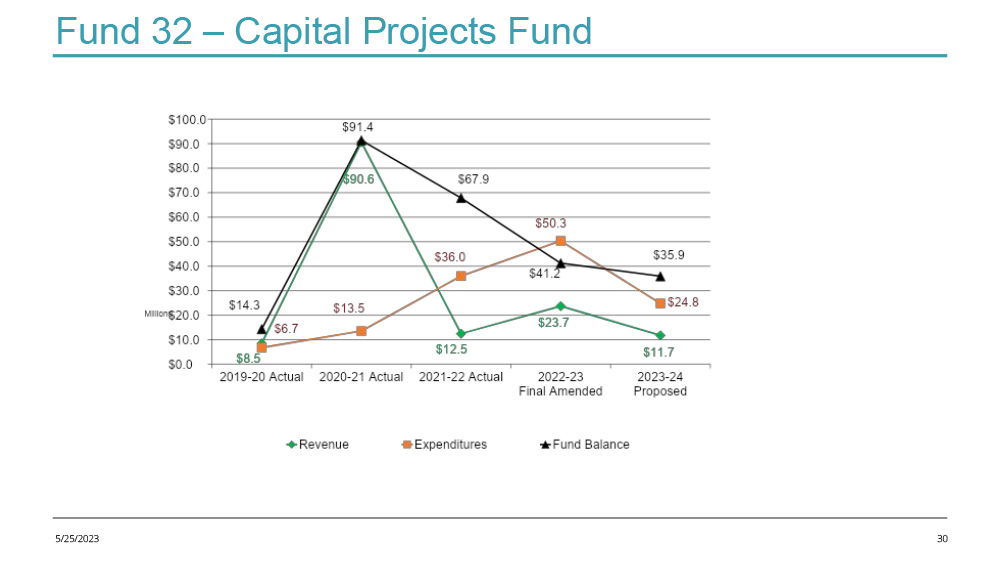
Fund 32 – Capital Projects Fund – a graph showing the revenue, expenditures and fund balance
Capital Projects Fund – The schedule of revenues, expenditures and changes in fund balance for the Capital Projects Fund for 2019 through 2024.
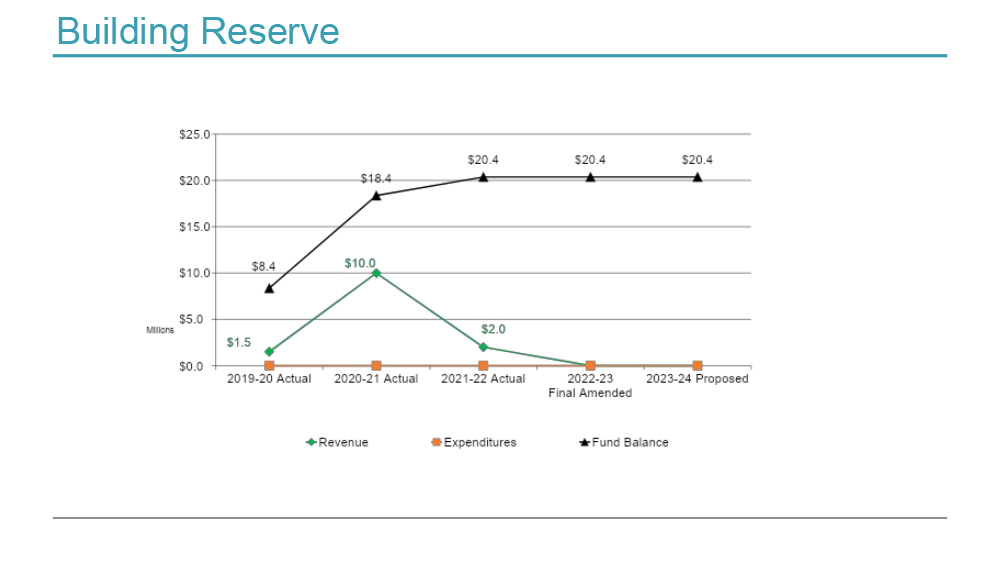
Building Reserve – a graph showing revenue, expenditures and fund balance
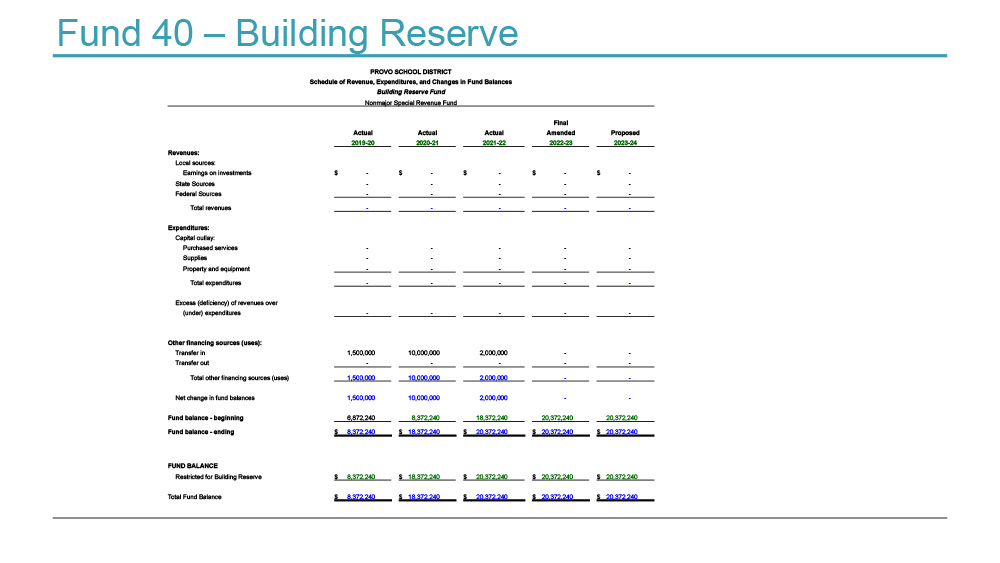
Fund 40 – Building Reserve – The schedule of revenues, expenditures and changes in fund balance for the Building Reserve Fund for 2019 through 2024.
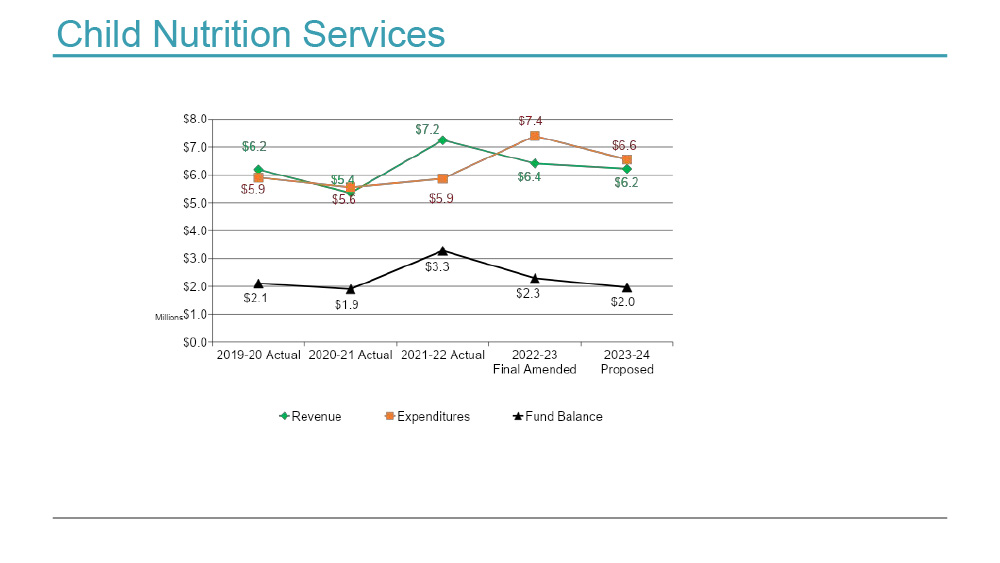
Child Nutrition Services – a graph showing the revenue, expenditures and fund balance
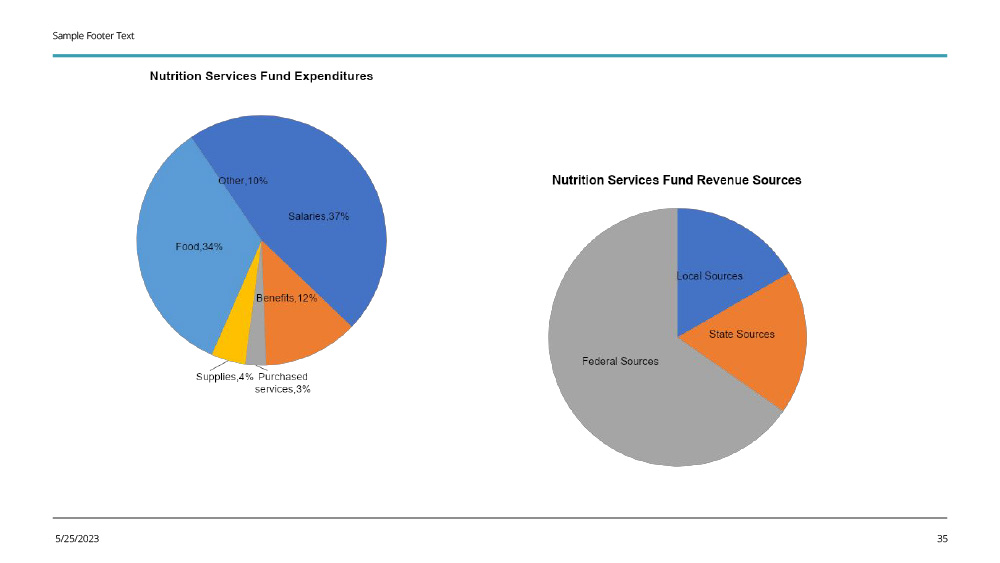
Graphs showing expenditures in the Child Nutrition fund by object and revenue by source
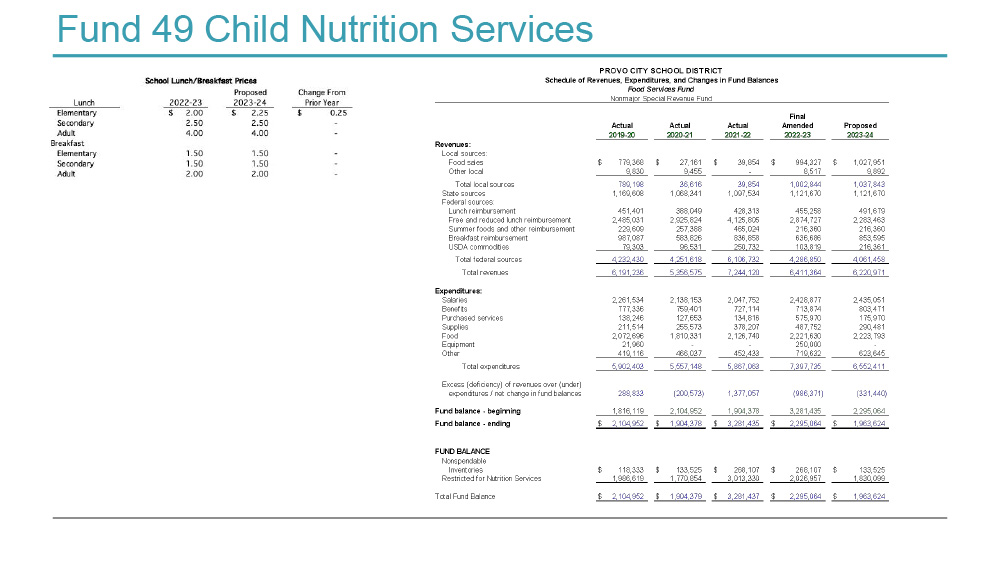
Fund 49 Child Nutrition Services – The schedule of revenues, expenditures and changes in fund balance for the Child Nutrition Services Fund for 2019 through 2024.
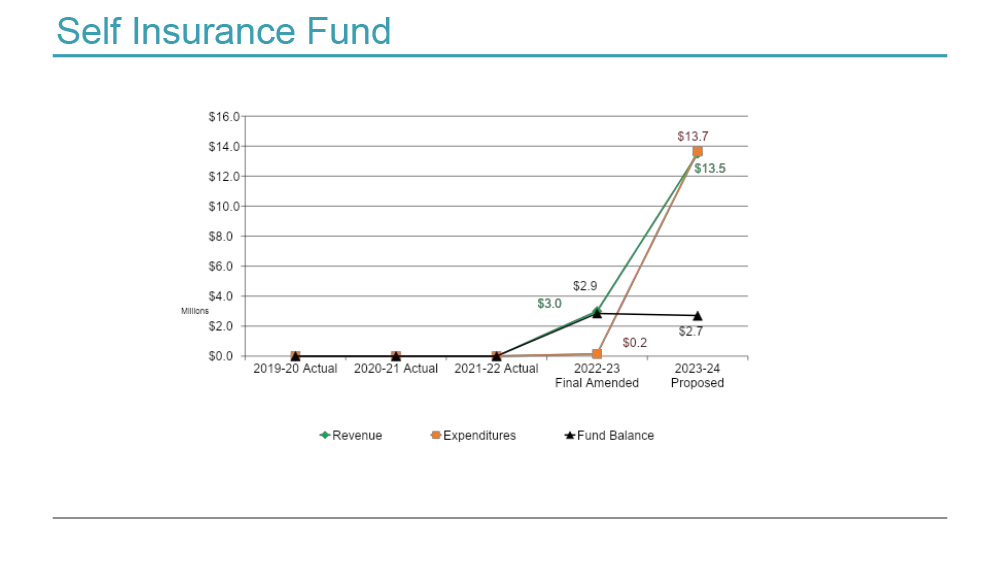
Self Insurance Fund – a graph showing the revenue, expenditures and fund balance
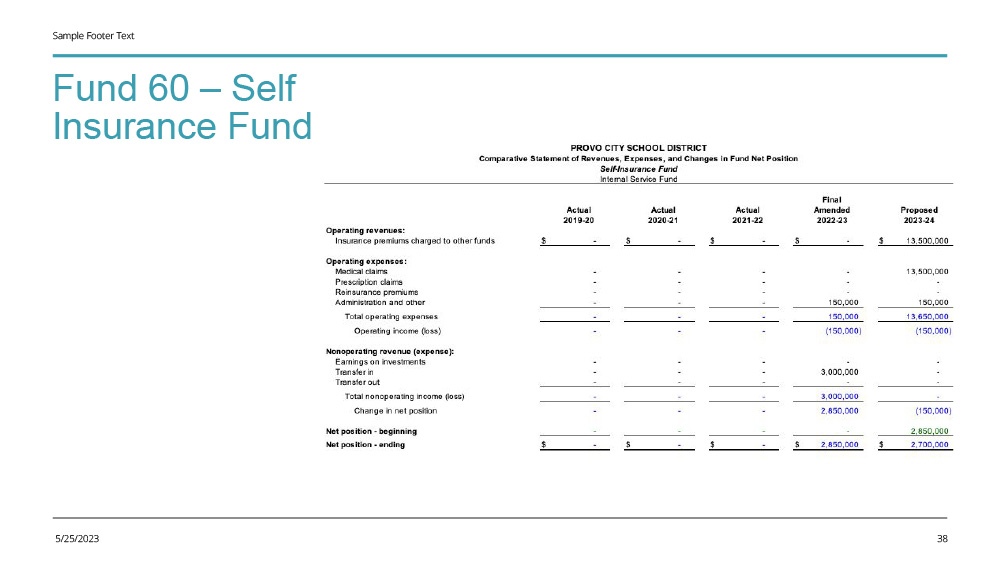
Fund 60 – Self Insurance Fund – The schedule of revenues, expenditures and changes in fund balance for the Self Insurance Fund for 2019 through 2024.
March 12 Asst 4 Custodial/Team Leader: Timpview High School March 13 Inst Asst 3/Extra...

Thanks to a state-funded grant, students who qualify next year for reduced-price meals will receive...

Each week, Superintendent Wendy Dau shares a video update with the Provo City community, providing...