
Employment Vacancies, April 22, 2024
 April 22nd, 2024
April 11, 2024 Grade 6 Teacher—–Provost April 12, 2024 Asst 1/Food...
Each year, the Business Department prepares the Comprehensive Annual Financial Report (CAFR) and the Popular Annual Financial Report (PAFR), which is then audited and published on our website. For the past 14 years, the Business Department has been recognized for conforming to the highest standards of preparation of state and local government for these reports. The reports, though thorough, can be time consuming and difficult to sift through. Here we are providing a quick reference of important financial data extracted from the full report. The full report can be found on the Business Department’s webpage, in addition to other financial reports published each year.
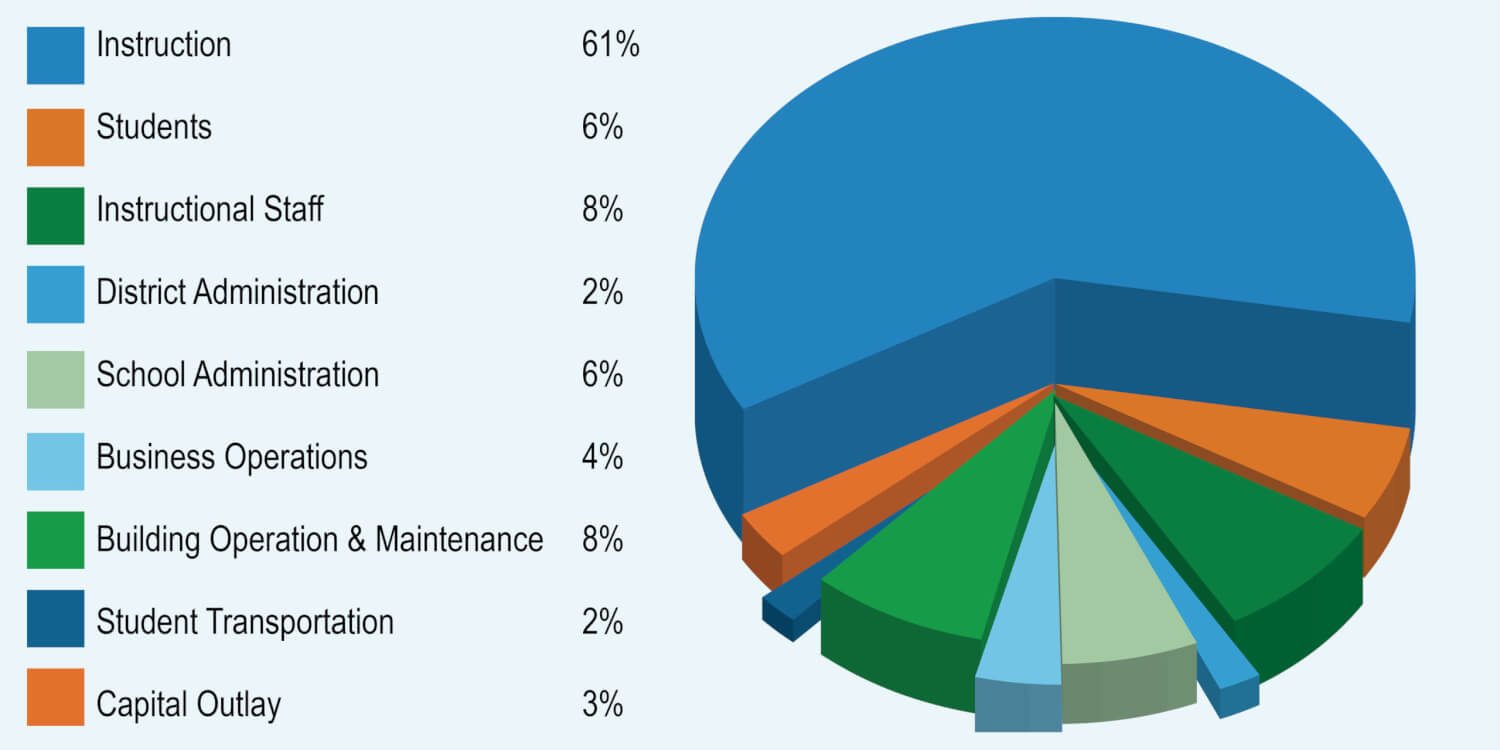
This graphic presents the % of the total general fund expenses that is spent on each of the functions/categories. The General Fund is the main operating fund of the school District. As an example, 61% of our total GF (operating) expenditures is spent on instruction, while 2% is spent on District Administration.
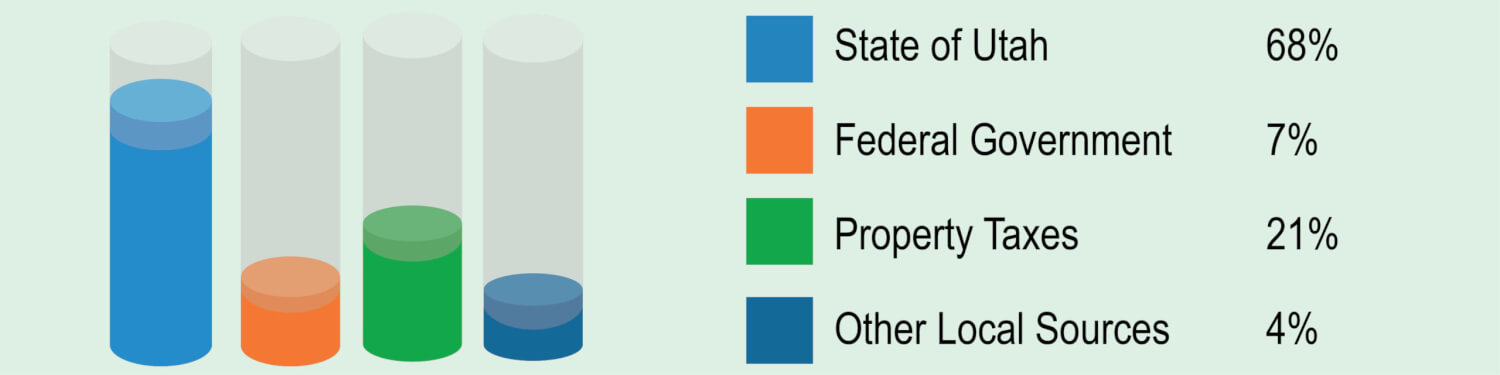
This graphic presents the sources of our revenue in the General Fund. In other words, where our operating income comes from. In the General Fund, most of the revenue comes from State funding via the minimum school program (MSP) and the weighted pupil unit (WPU), and local property taxes.
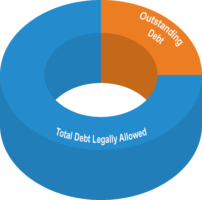
This presents how much debt the district is legally allowed to carry vs. the amount of debt already utilized. As of 6/30/19 PCSD’s legal debt maximum was $377 million. Of that, outstanding/issued debt was $108 million, leaving a debt margin of $268 million. The debt margin is the remaining amount of debt the District could legally undertake as of 6/30/19. The amount of debt allowed under law generally increases each year as it is based on fair market value of the property in the district boundaries. Provo City School District is at 29% of the legal debt margin.
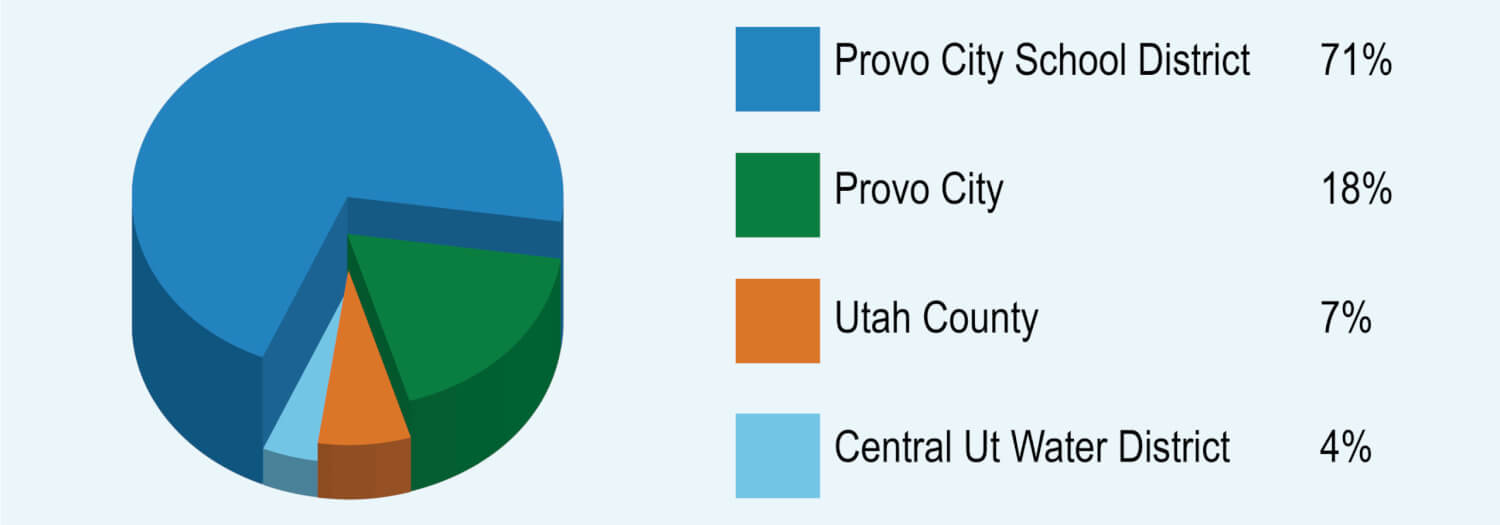
In Provo, local property taxes are collected and used by several entities. This pie chart presents how much of a Provo resident’s total property tax rate is attributed to Provo City, Provo City School District, Utah County and the Central Water District.
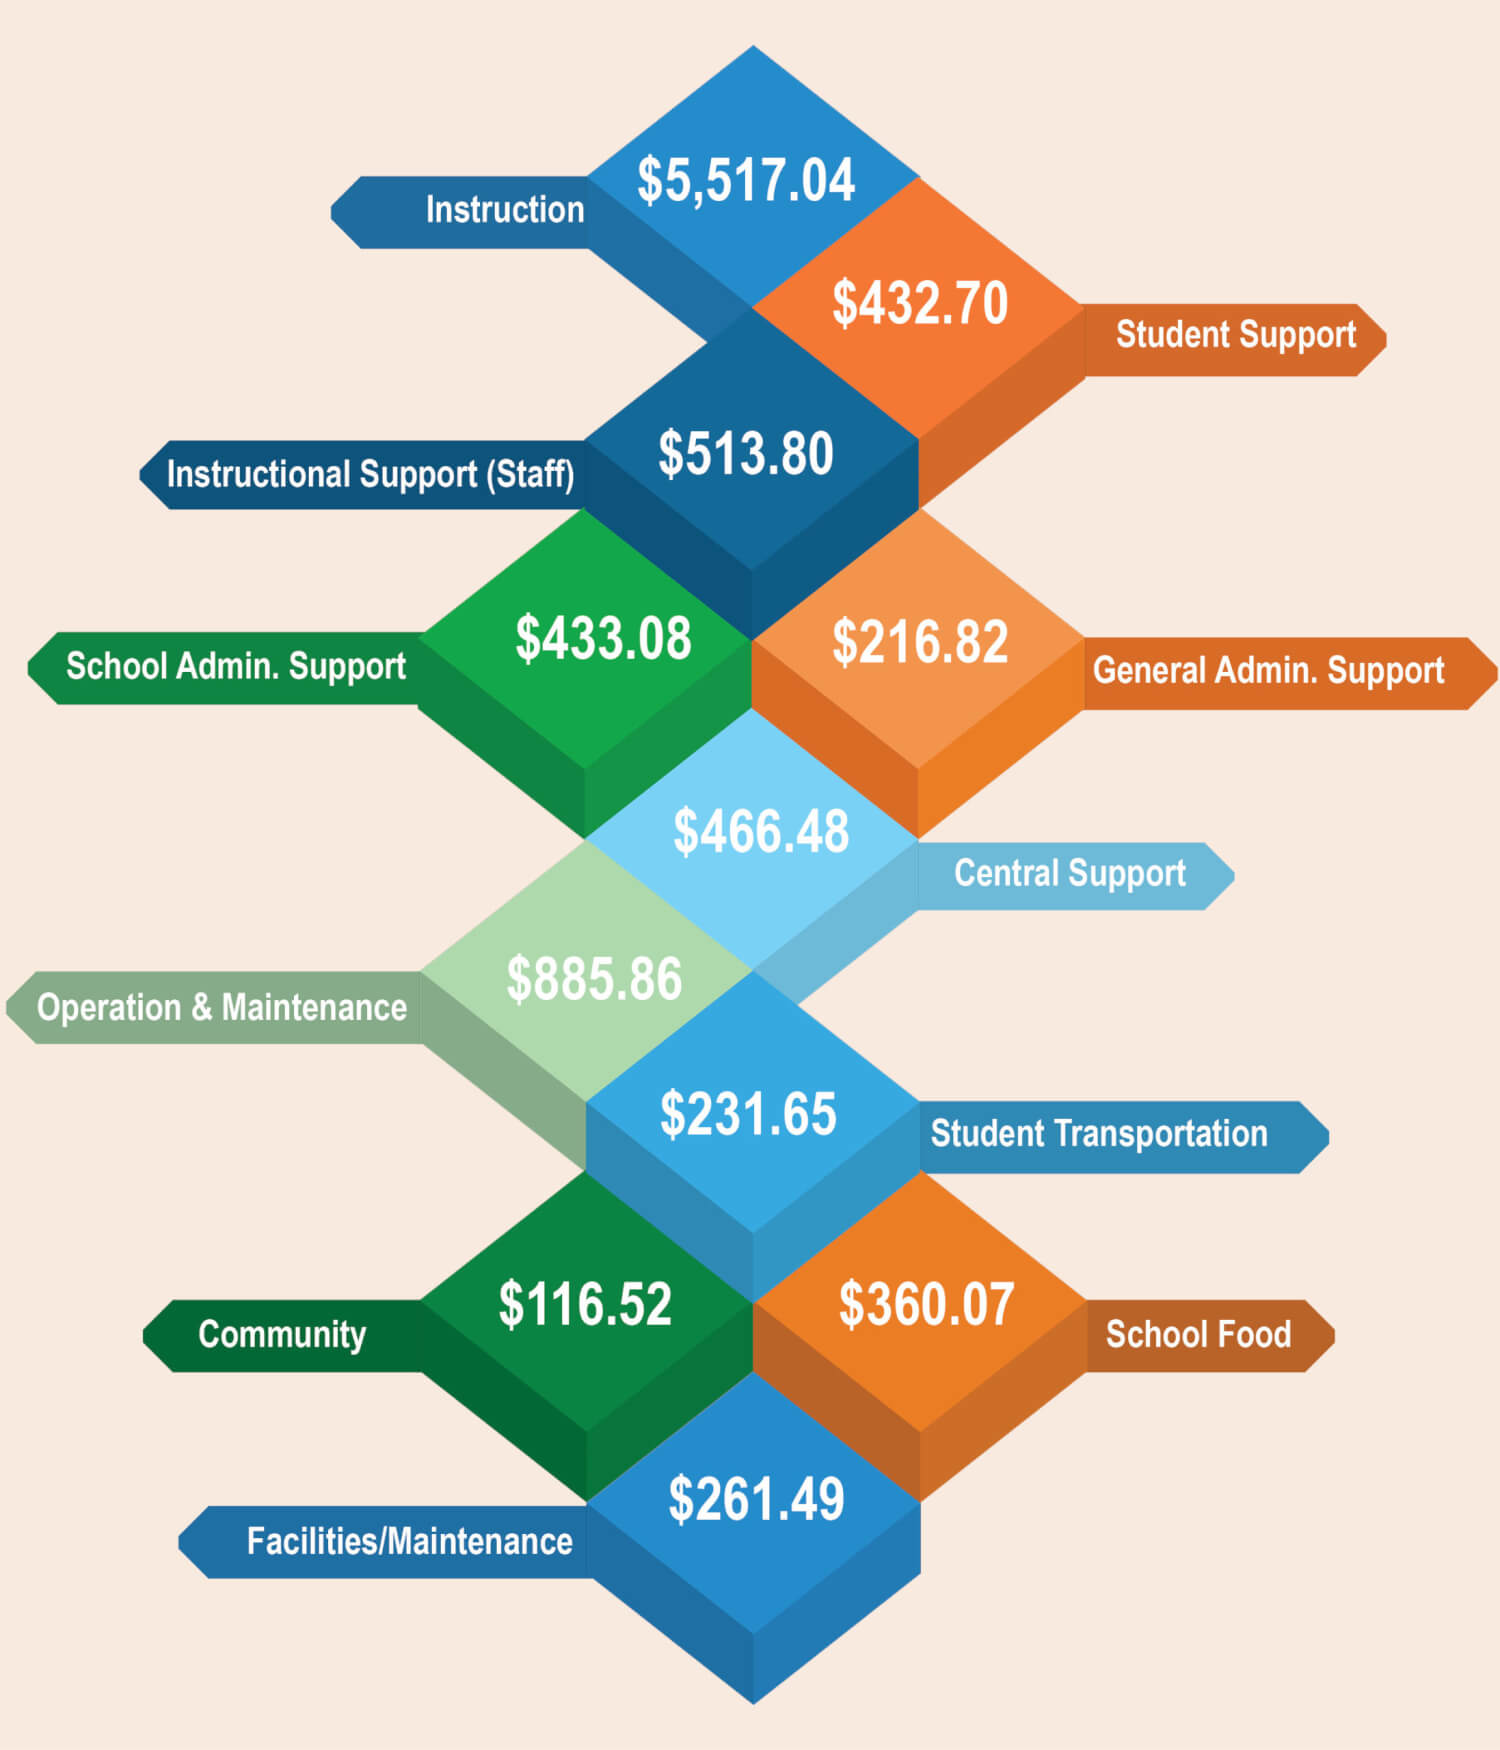
This graphic presents the categories of expenditures on an average per pupil basis. $5,517.04 was spent on instruction, $432.70 on Student Support Services, $513.80 on Instructional Support Services (staff) ,$216.82 on General Adminastrative Support Services, $433.08 on School Administrative Support Services, $466.48 on Central Support Services, $885.86 on Operation and Maintenance Services, $231.65 on Student Transportation Services, $360.07 on School Food Services, $116.52 on Community Services and $261.49 on Facilities/Maintenance.
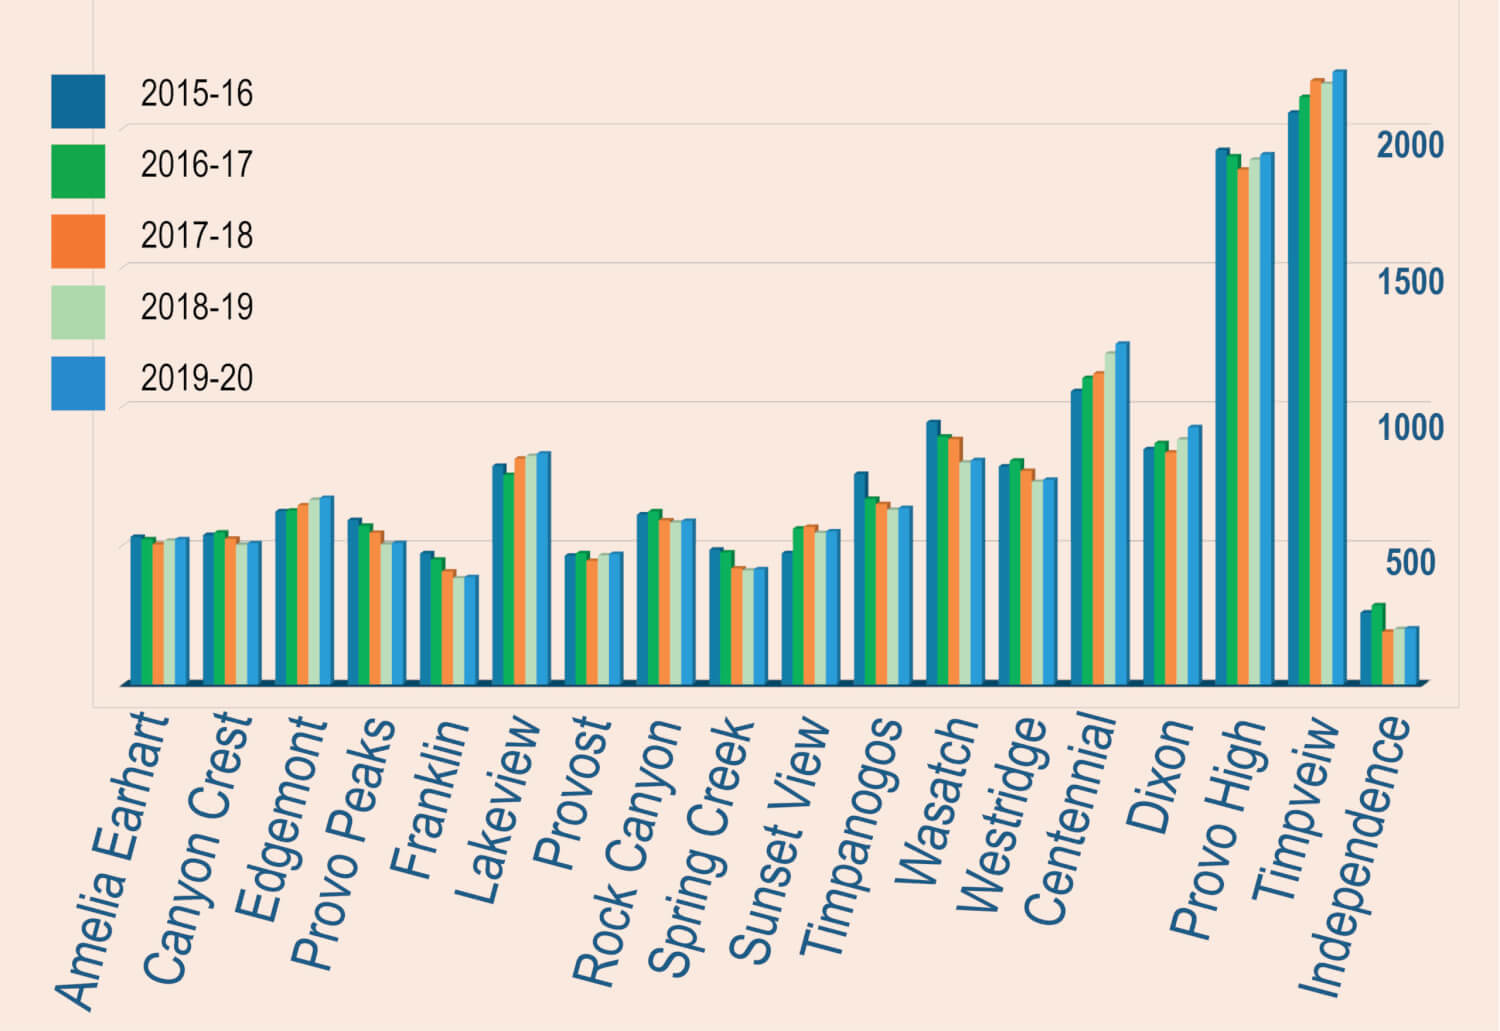
This simply presents five years of enrollment history for PCSD by school.
School |
2015-16 |
2016-17 |
2017-18 |
2018-19 |
2019-20 |
|---|---|---|---|---|---|
| Amelia Earhart Elementary | 532 | 523 | 504 | 518 | 523.18 |
| Canyon Crest Elementary | 538 | 547 | 524 | 503 | 508.03 |
| Edgemont Elementary | 623 | 626 | 645 | 665 | 671.65 |
| Provo Peaks Elementary2 | 592 | 571 | 546 | 504 | 509.04 |
| Franklin Elementary | 472 | 450 | 407 | 383 | 386.83 |
| Lakeview Elementary1 | 787 | 754 | 813 | 823 | 831.23 |
| Provost Elementary | 464 | 472 | 445 | 465 | 469.65 |
| Rock Canyon Elementary | 612 | 623 | 591 | 583 | 588.83 |
| Spring Creek Elementary | 486 | 476 | 418 | 411 | 415.11 |
| Sunset View Elementary | 473 | 561 | 568 | 546 | 551.46 |
| Timpanogos Elementary | 758 | 668 | 649 | 629 | 635.29 |
| Wasatch Elementary | 944 | 892 | 883 | 799 | 806.99 |
| Westridge Elementary | 785 | 806 | 769 | 730 | 737.3 |
| Centennial Middle | 1056 | 1103 | 1119 | 1191 | 1226.73 |
| Dixon Middle | 847 | 869 | 835 | 882 | 926.1 |
| Provo High | 1924 | 1901 | 1853 | 1889 | 1907.89 |
| Timpview High | 2058 | 2114 | 2173 | 2162 | 2205.24 |
| Independence High | 259 | 285 | 190 | 200 | 202 |
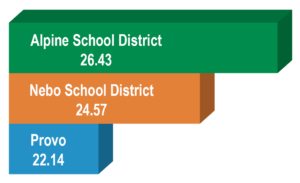
This shows a comparison of average class sizes for school districts in the area and a state wide average.
Oldest to newest.
School Name |
Build Year |
|---|---|
| Dixon | 1931 |
| Wasatch | 1949 |
| Timpview | 1974 |
| Westridge | 1979 |
| Canyon Crest | 1982 |
| Independence | 1992 |
| Franklin | 1994 |
| Centennial | 1996 |
| Amelia Earhart | 1999 |
| Spring Creek | 2002 |
| Lakeview | 2007 |
| Timpanogos | 2008* |
| Provo Peaks | 2011* |
| Rock Canyon | 2016* |
| Sunset View | 2016* |
| Edgemont | 2017* |
| Provo High | 2018* |
| Provost | 2018* |
*New Rebuilds
April 11, 2024 Grade 6 Teacher—–Provost April 12, 2024 Asst 1/Food...
During the April 16 Board Meeting, the school board received an updated report of the ongoing...
Last term, Provo High School's Dance Company and AP Art students collaborated to create their...